Fig. 14
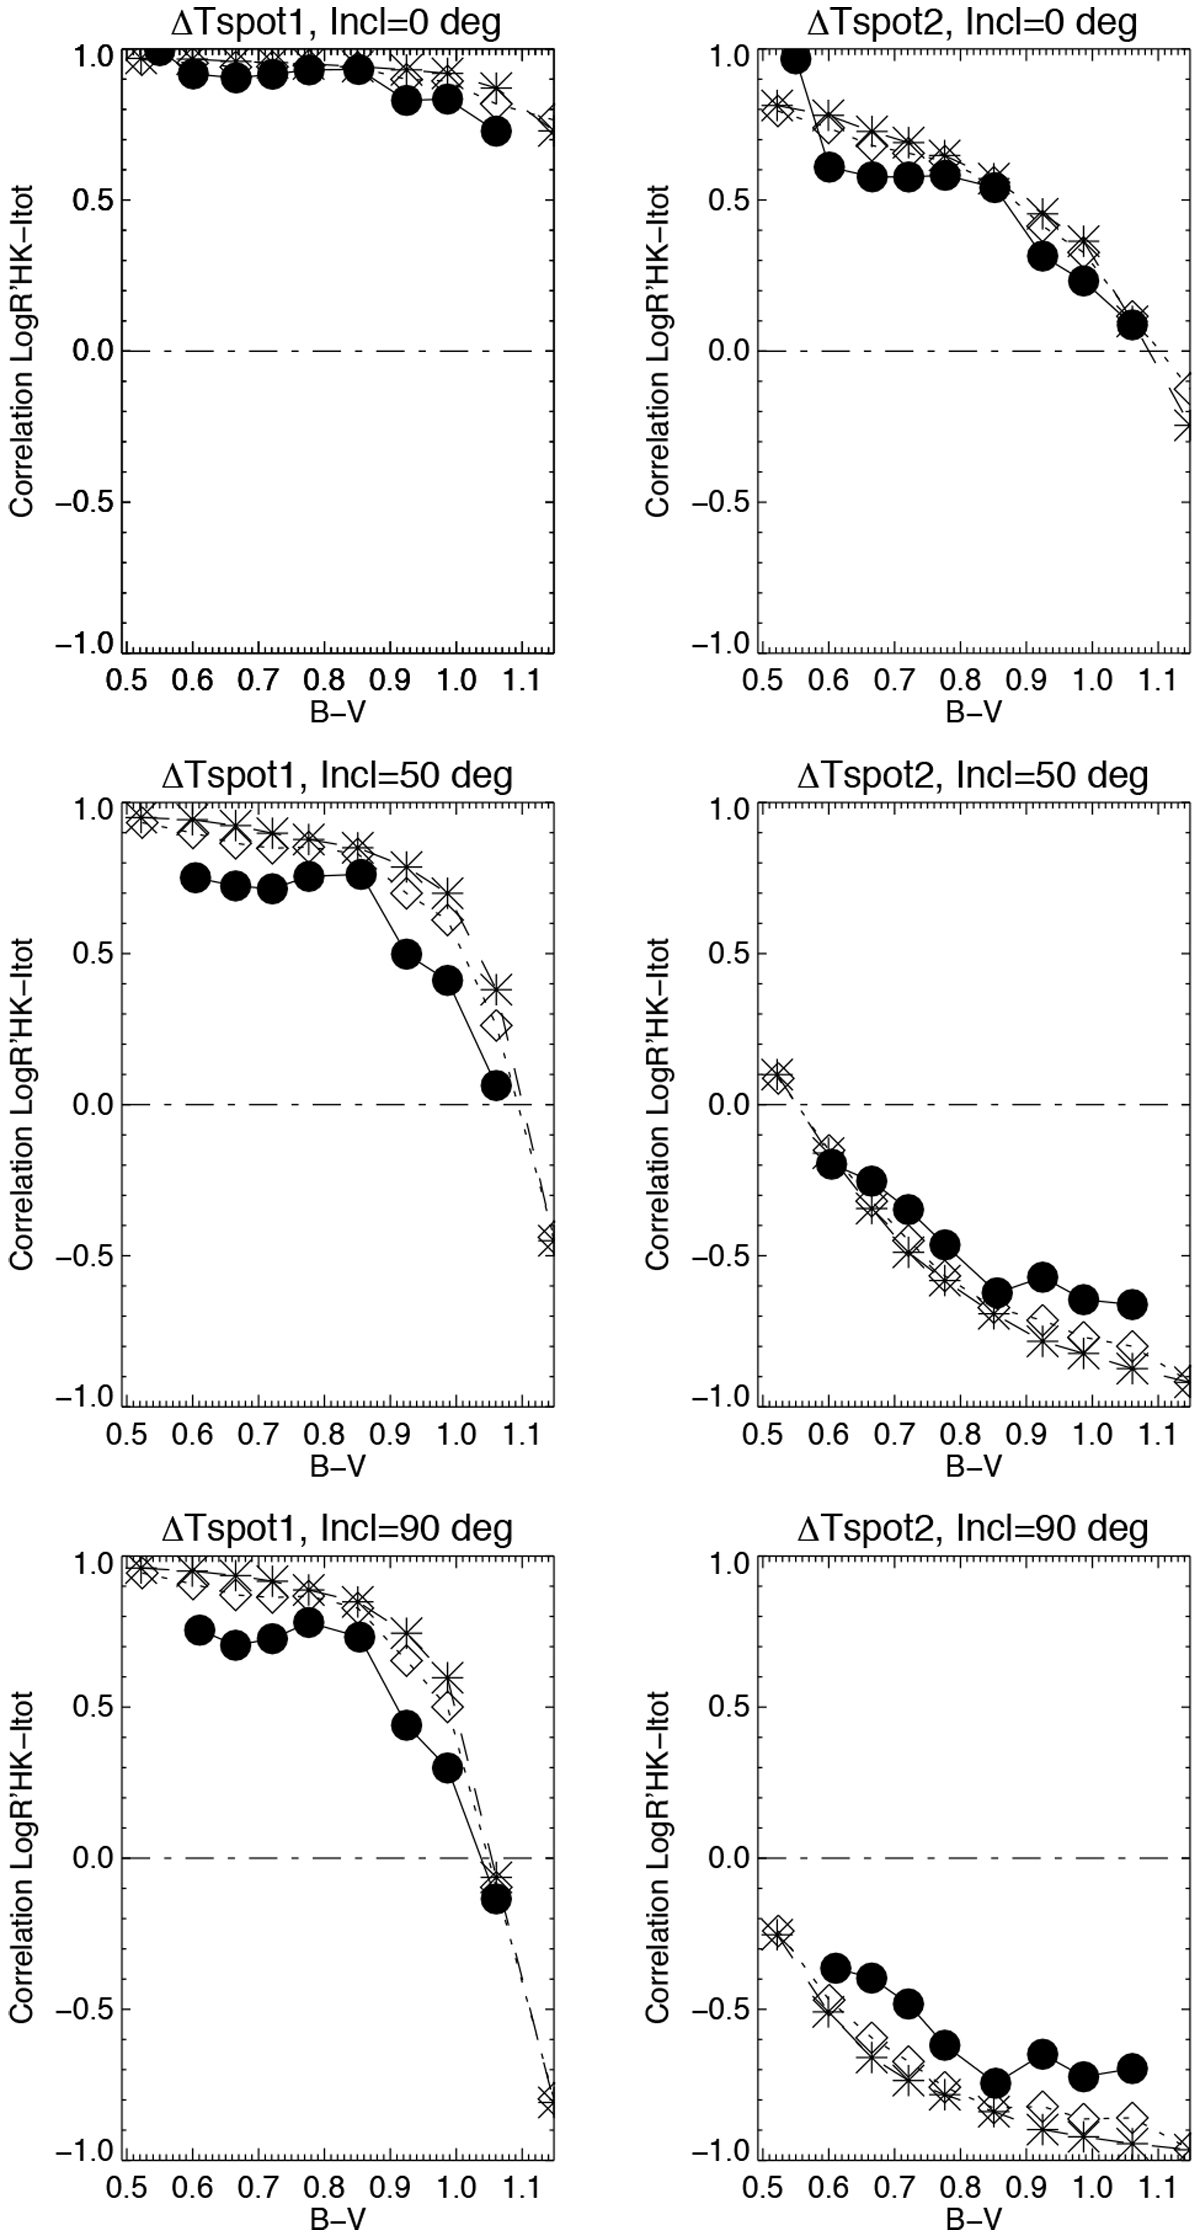
Correlation between Log ![]() and Itot binned in B−V for ΔTspot1 (left) and ΔTspot2 (right), for several activity levels: average Log
and Itot binned in B−V for ΔTspot1 (left) and ΔTspot2 (right), for several activity levels: average Log ![]() below −5.0 (circles), between −4.9 and −4.8 (stars) and above −4.7 (diamonds). Upper panels: for an inclination of 0° (pole-on) Middle panels: for an inclination of 50°. Lower panels: for an inclination of 90° (edge-on).
below −5.0 (circles), between −4.9 and −4.8 (stars) and above −4.7 (diamonds). Upper panels: for an inclination of 0° (pole-on) Middle panels: for an inclination of 50°. Lower panels: for an inclination of 90° (edge-on).
Current usage metrics show cumulative count of Article Views (full-text article views including HTML views, PDF and ePub downloads, according to the available data) and Abstracts Views on Vision4Press platform.
Data correspond to usage on the plateform after 2015. The current usage metrics is available 48-96 hours after online publication and is updated daily on week days.
Initial download of the metrics may take a while.