Fig. 13
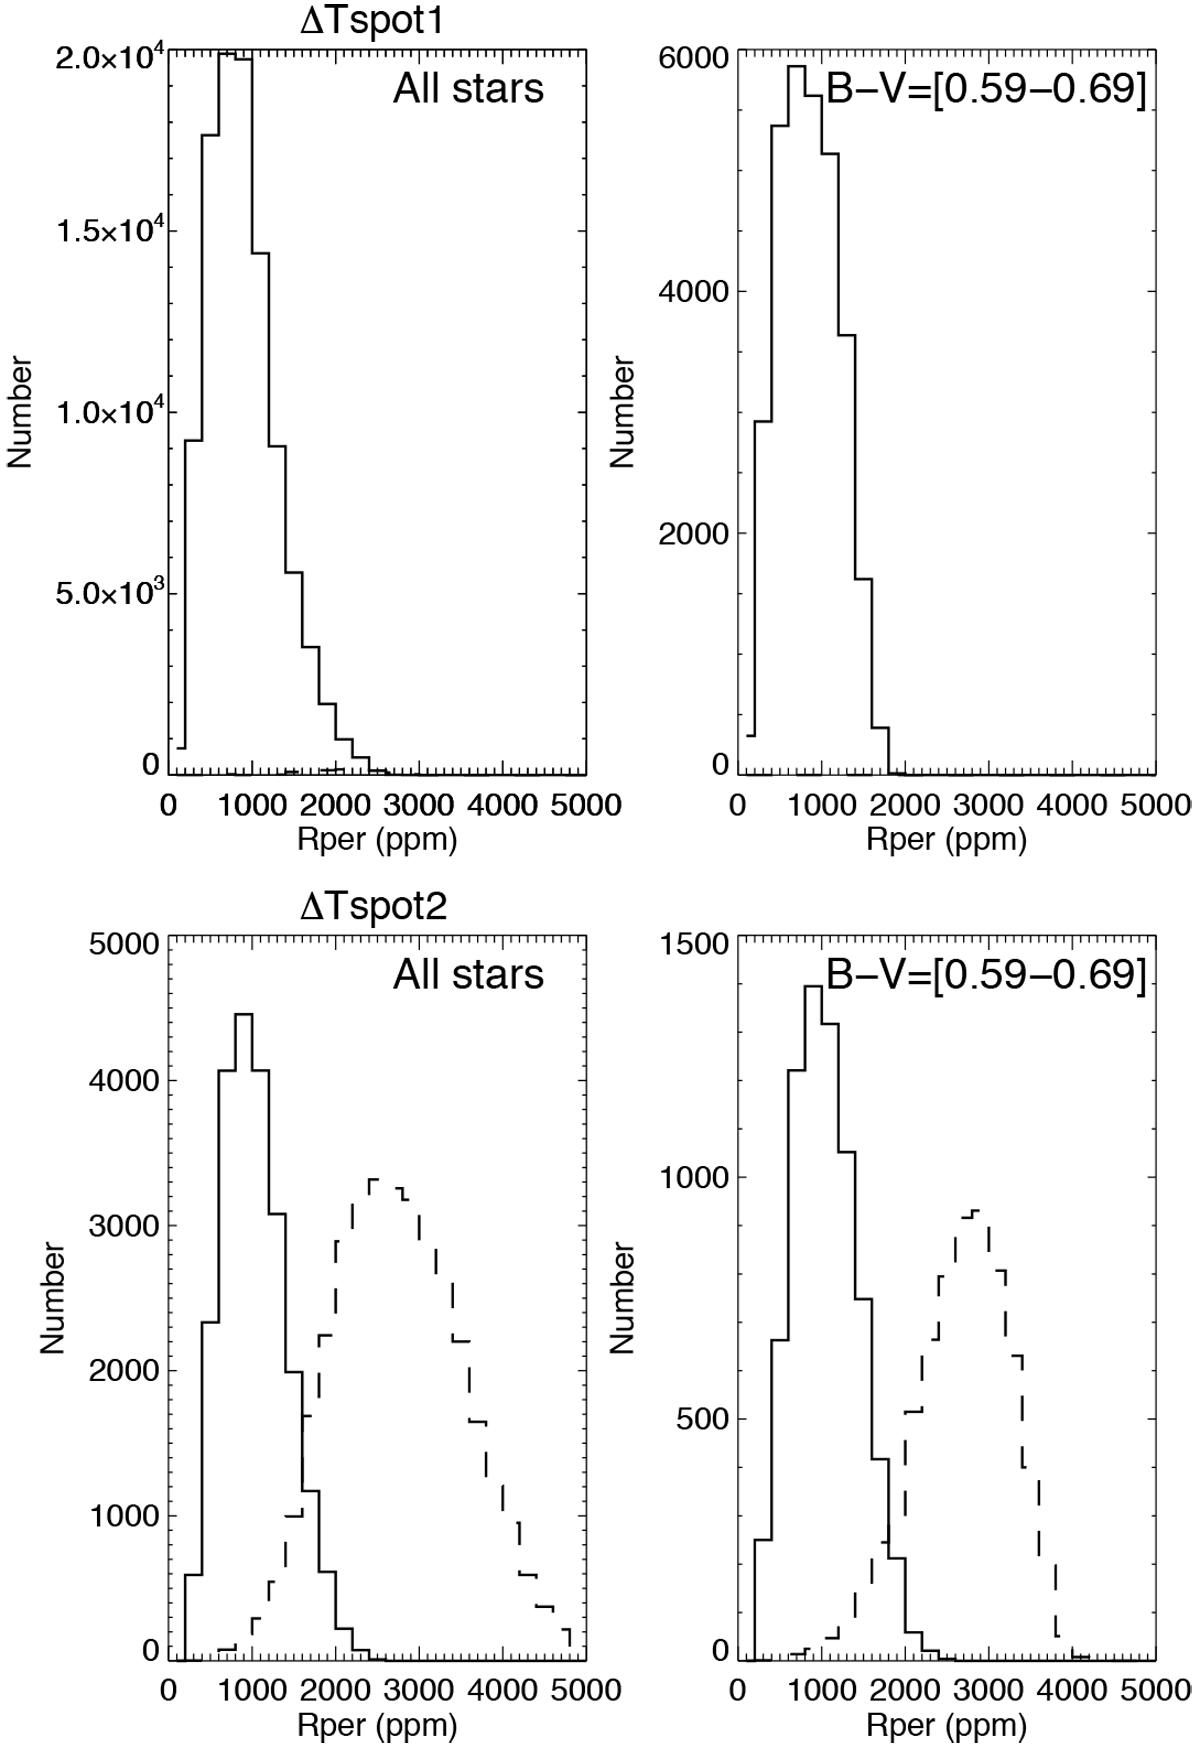
Distribution of number of simulations with correlation C
between Log ![]() and Itot larger than 0.6 (solid line) and lower than −0.6 (dashed line) for ΔTspot1 (upper panels) and ΔTspot2 (lower panels). The left panels are for all spectral types and the right panels for stars with B− V between 0.59 and 0.69 (for a comparison with Montet et al. 2017).
and Itot larger than 0.6 (solid line) and lower than −0.6 (dashed line) for ΔTspot1 (upper panels) and ΔTspot2 (lower panels). The left panels are for all spectral types and the right panels for stars with B− V between 0.59 and 0.69 (for a comparison with Montet et al. 2017).
Current usage metrics show cumulative count of Article Views (full-text article views including HTML views, PDF and ePub downloads, according to the available data) and Abstracts Views on Vision4Press platform.
Data correspond to usage on the plateform after 2015. The current usage metrics is available 48-96 hours after online publication and is updated daily on week days.
Initial download of the metrics may take a while.