Fig. 5.
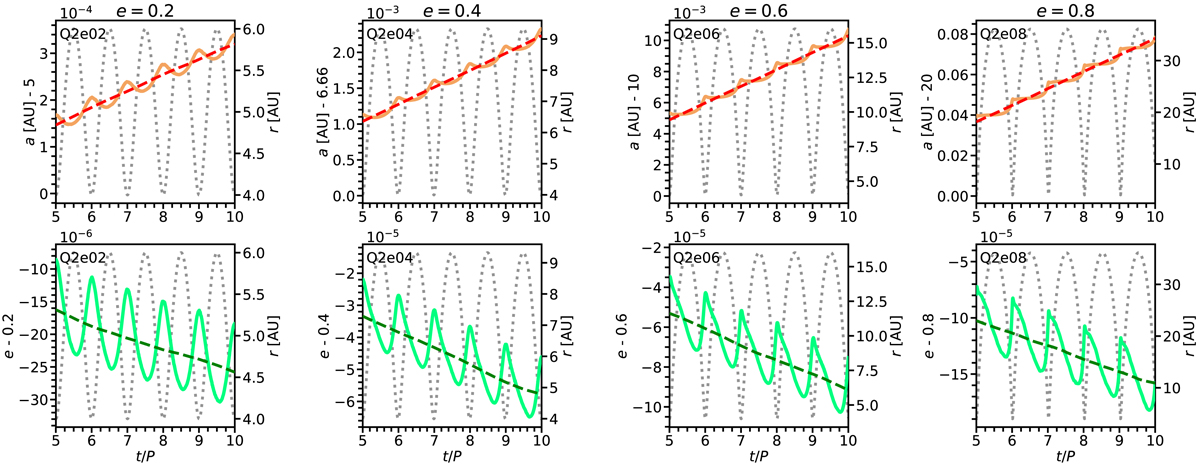
Top panels: semi-major axis as a function of time, relative to the orbital period, for models Q2e02 to Q2e08 (solid lines). Notice that since the change in the orbit is very small (between 10−4 and 10−2 AU), for better visualisation the order of magnitude of the quantities along the y-axis is given in the top-left corner. Bottom panels: eccentricity as a function of t/P for models Q2e02 to Q2e08 (solid lines). Similar to a, the order of magnitude of the quantities along the y axis is given in the top-left corner. The dashed lines in each panel show the moving average of a and e over the interval [t/P − 0.5, t/P + 0.5], for better appreciation of the long-term trend. We only show the evolution of a and e for the last five orbits of our simulations. The dotted grey lines correspond to the distance between the stars, with the minimum corresponding to periastron and the maximum to apastron.
Current usage metrics show cumulative count of Article Views (full-text article views including HTML views, PDF and ePub downloads, according to the available data) and Abstracts Views on Vision4Press platform.
Data correspond to usage on the plateform after 2015. The current usage metrics is available 48-96 hours after online publication and is updated daily on week days.
Initial download of the metrics may take a while.