Fig. 3.
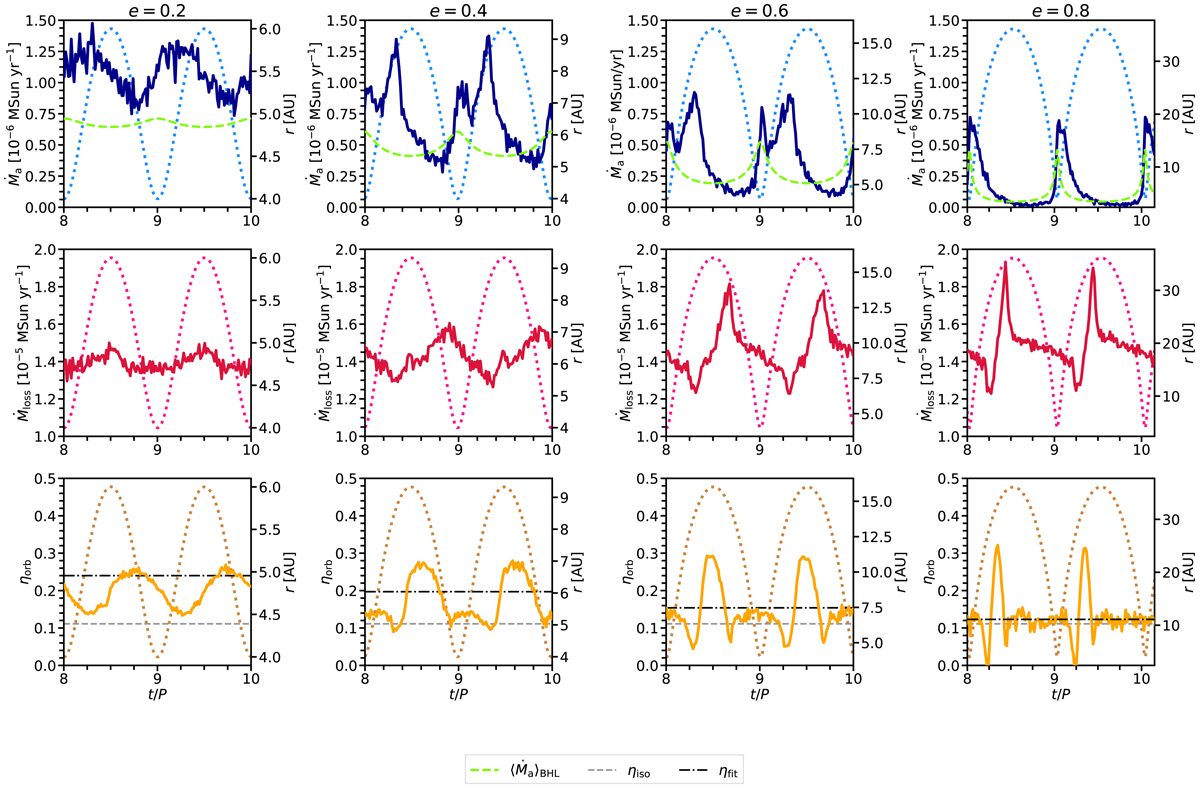
Top panels: mass-accretion rate (solid dark blue line) as a function of the orbital phase, t/P, during the last two simulated orbits for models Q2a02 to Q2e08. The eccentricity increases from left to right. The green dashed line corresponds to the BHL accretion rate as computed with Eq. (3) and αBHL = 0.75. The dotted light blue line corresponds to the distance between the stars (right-hand scale). Middle panels: mass-loss rate as a function of time (solid red line) for the same models, measured as the flux crossing a sphere of radius 3a. The dotted pink line corresponds to the distance between the stars. Bottom panels: corresponding angular-momentum loss expressed by the parameter η as a function of time (solid yellow line). The distance between the star is shown with the dotted brown line. The dashed grey line corresponds to the isotropic-wind value ηiso = (1 + q)−2, and the black dashed dotted line corresponds to the expected angular-momentum loss as computed by applying the fitting formula for angular-momentum loss from Paper II to the average orbital velocity.
Current usage metrics show cumulative count of Article Views (full-text article views including HTML views, PDF and ePub downloads, according to the available data) and Abstracts Views on Vision4Press platform.
Data correspond to usage on the plateform after 2015. The current usage metrics is available 48-96 hours after online publication and is updated daily on week days.
Initial download of the metrics may take a while.