Fig. 1.
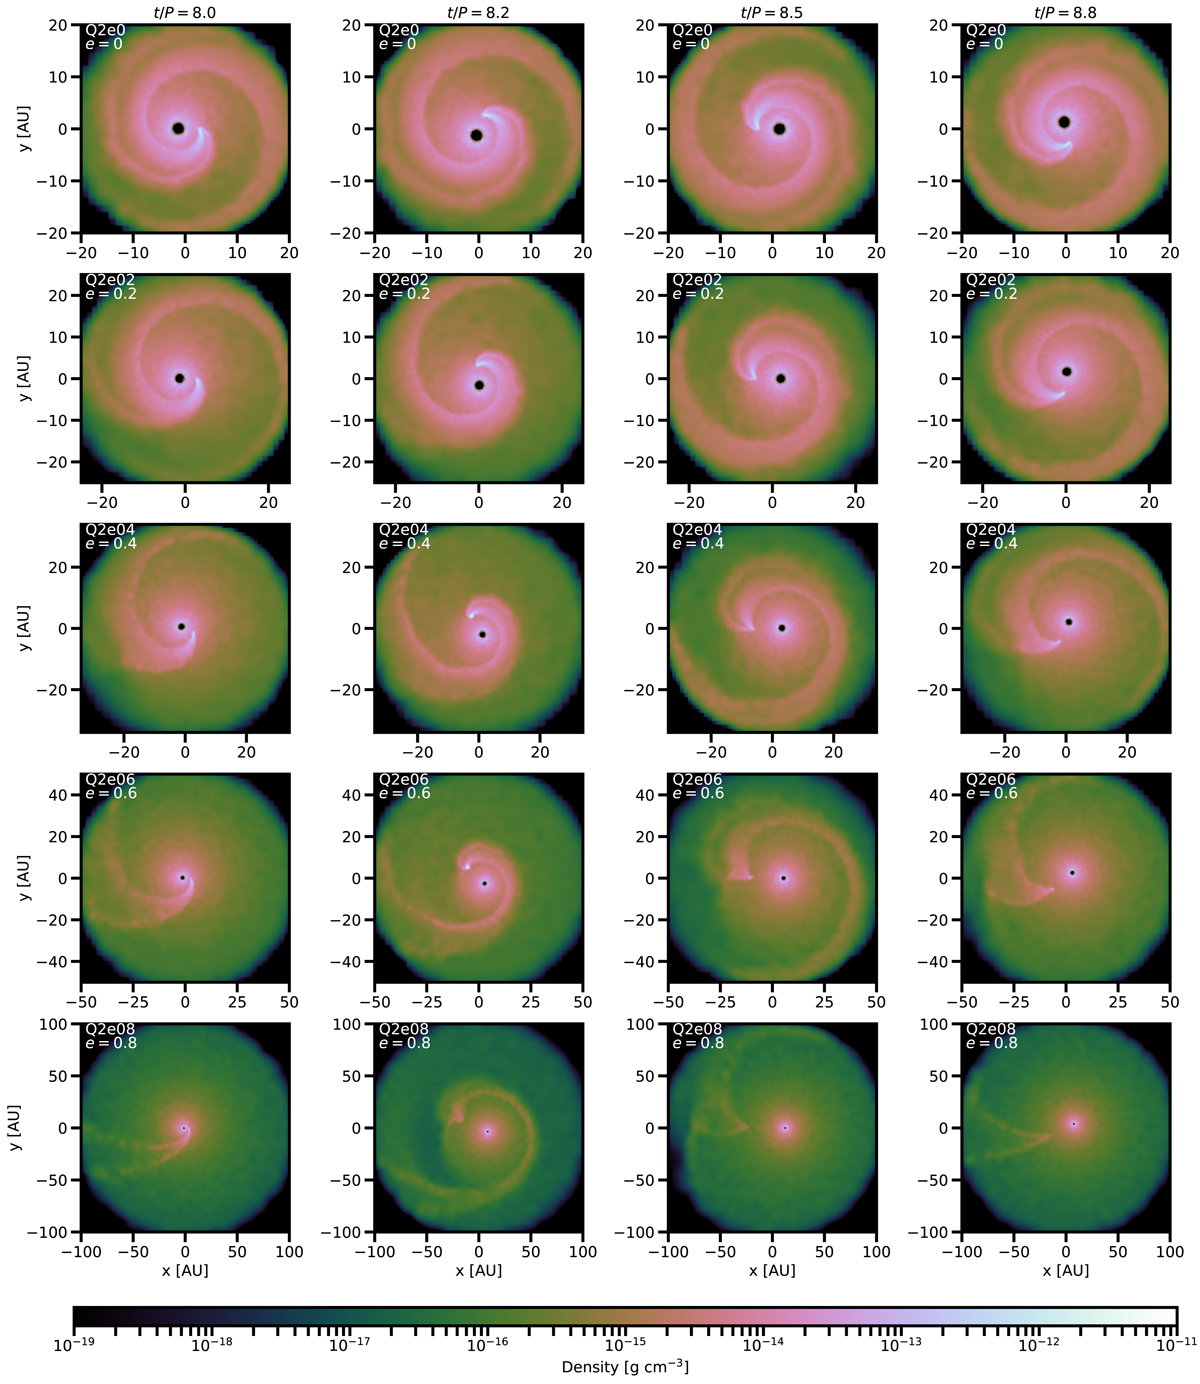
Gas density on the orbital plane for different orbital phases for models Q2e0 to Q2e08 during the ninth simulated orbit. The eccentricity increases from top to bottom. Time is indicated along the top, relative to the orbital period. The first column corresponds to the phase where the stars are at periastron, the second column to the phase t/P = 8.2, the third column to the time when stars are at apastron and the fourth column corresponds to t/P = 8.8.
Current usage metrics show cumulative count of Article Views (full-text article views including HTML views, PDF and ePub downloads, according to the available data) and Abstracts Views on Vision4Press platform.
Data correspond to usage on the plateform after 2015. The current usage metrics is available 48-96 hours after online publication and is updated daily on week days.
Initial download of the metrics may take a while.