Fig. 5.
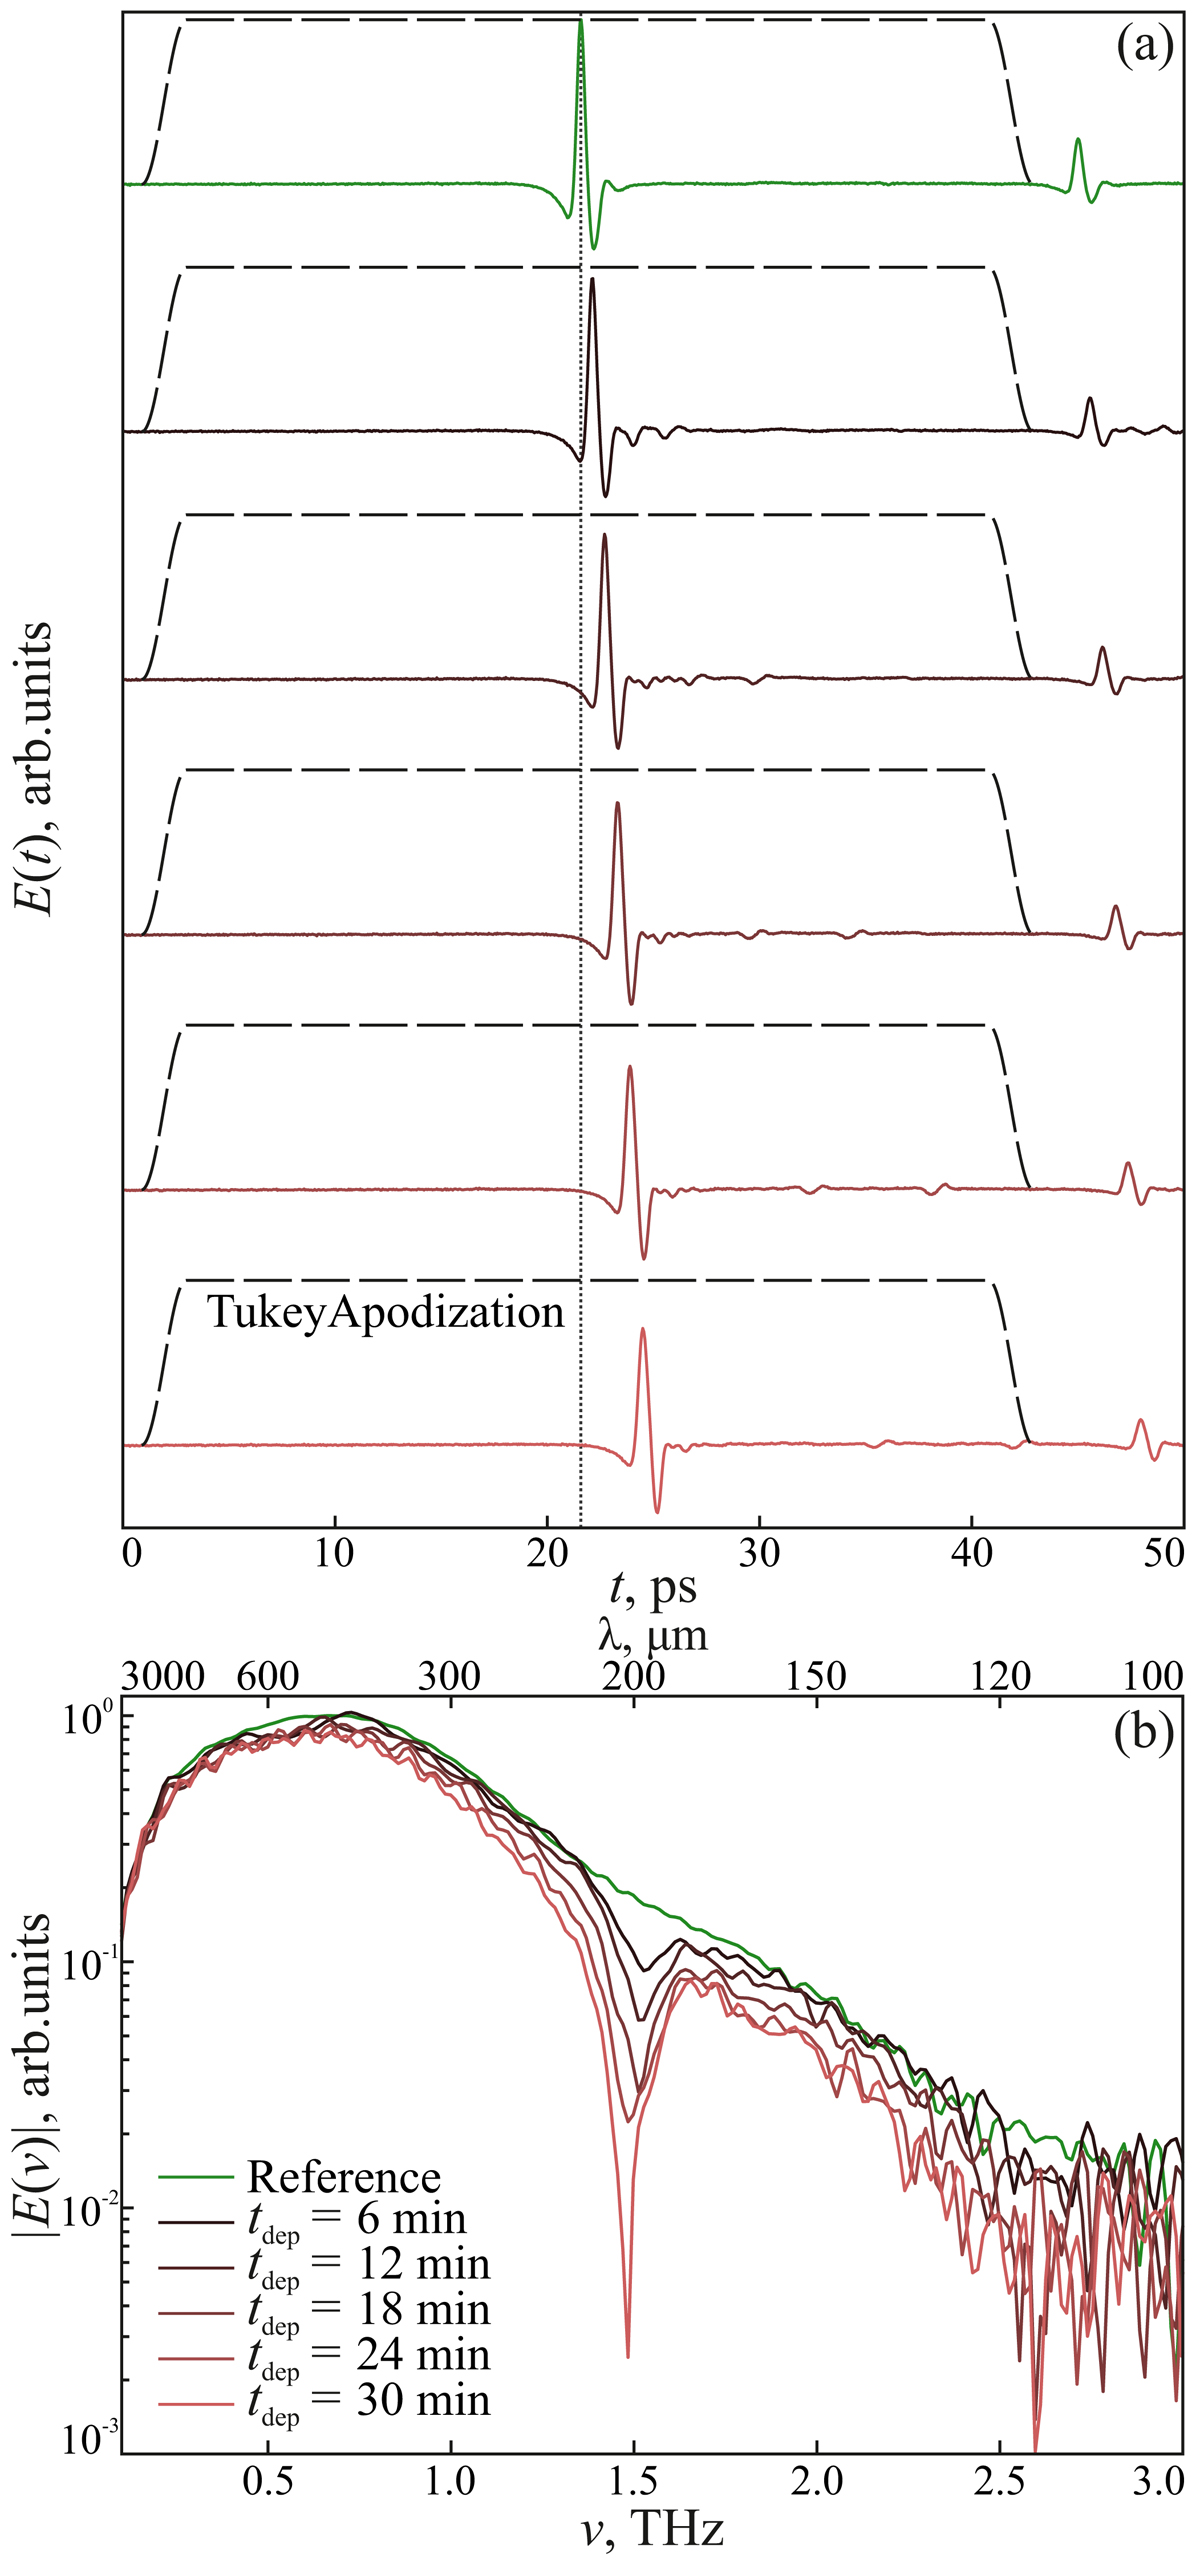
Evolution of the THz pulse and its spectra during the CO ice deposition. Panel a: reference waveform E(t) transmitted through the cryostat with the empty substrate (green), and sample waveforms (black to light red) transmitted through the substrate with the CO ice deposited on its surfaces. Panel b: Fourier spectra |E(ν)| of the reference and sample THz waveforms calculated with the use of Tukey apodization. The waveforms in (a) and spectra in (b) correspond to different values of the total deposition time tdep (indicated); the deposition intervals are Δtdep = 6 min.
Current usage metrics show cumulative count of Article Views (full-text article views including HTML views, PDF and ePub downloads, according to the available data) and Abstracts Views on Vision4Press platform.
Data correspond to usage on the plateform after 2015. The current usage metrics is available 48-96 hours after online publication and is updated daily on week days.
Initial download of the metrics may take a while.