Fig. 3.
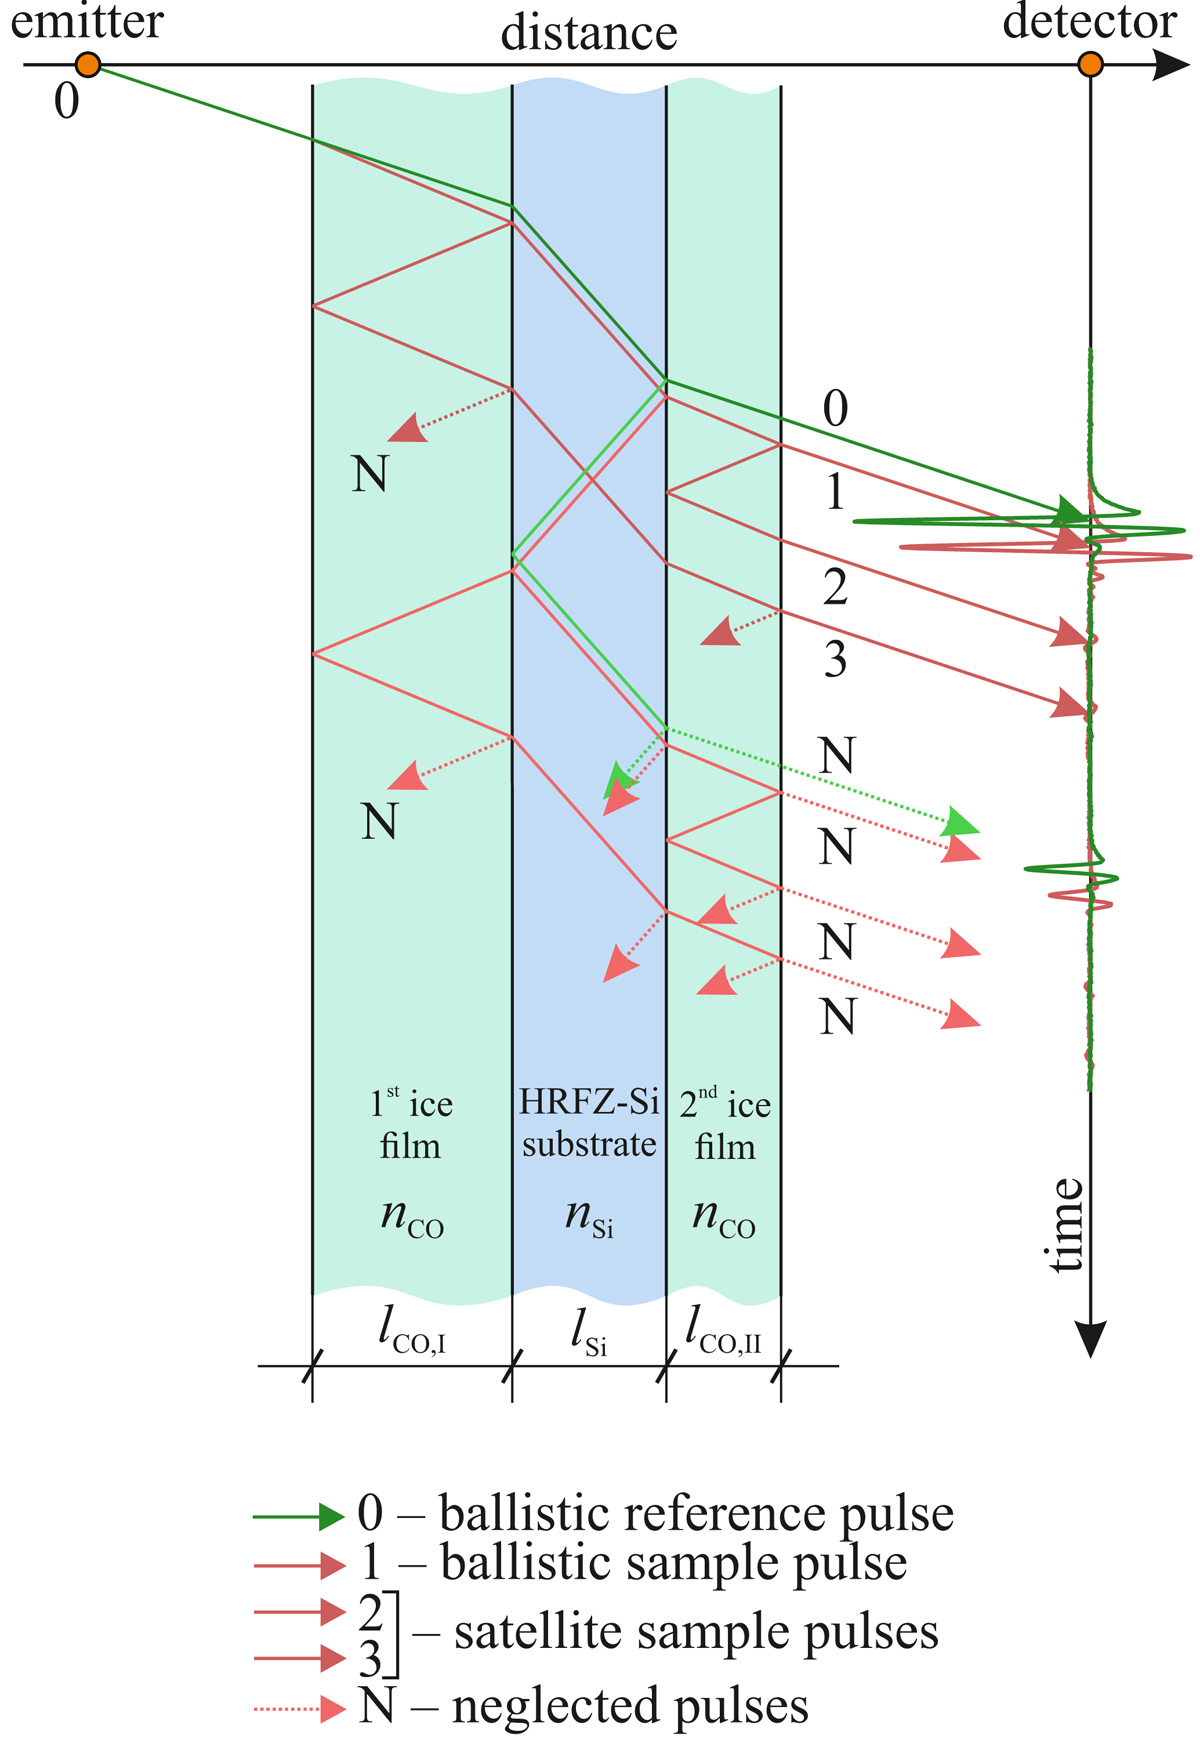
Time–distance diagram illustrating the THz wave propagation through the HRFZ-Si substrate with ice films deposited on its surfaces. Lines 0–3 illustrate the ballistic pulse and satellite pulses transmitted in the direction of the antenna-detector; N stands for unaccounted satellites with larger time delays. The solid lines represent the pulses used for the analysis, while dotted lines correspond to neglected pulses.
Current usage metrics show cumulative count of Article Views (full-text article views including HTML views, PDF and ePub downloads, according to the available data) and Abstracts Views on Vision4Press platform.
Data correspond to usage on the plateform after 2015. The current usage metrics is available 48-96 hours after online publication and is updated daily on week days.
Initial download of the metrics may take a while.