Fig. 6.
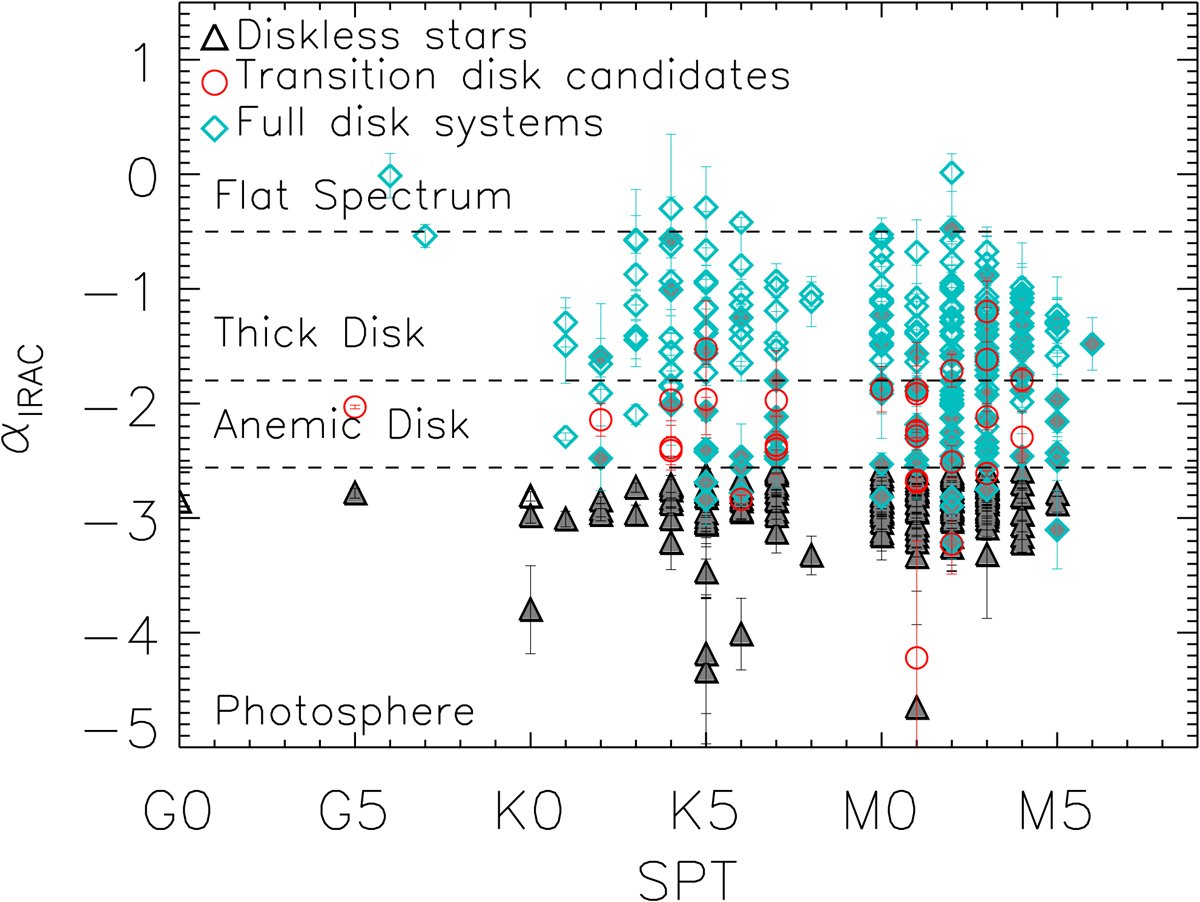
Slope of the SED from 3.6 μm to 8 μm (αIRAC) measured by Teixeira et al. (2012) as a function of the spectral type obtained by Venuti et al. (2014), Dahm & Simon (2005), Rebull et al. (2002), Walker (1956). Symbols indicate our categorization (notation as in Fig. 4). Our sample of transition disk candidates presents dust in the inner disk similar to anemic disks, which shows that anemic disk systems can be good candidates to transition disks. Systems for which we do not have data at 22/24 μm are identified by gray filled symbols.
Current usage metrics show cumulative count of Article Views (full-text article views including HTML views, PDF and ePub downloads, according to the available data) and Abstracts Views on Vision4Press platform.
Data correspond to usage on the plateform after 2015. The current usage metrics is available 48-96 hours after online publication and is updated daily on week days.
Initial download of the metrics may take a while.