Fig. 2.
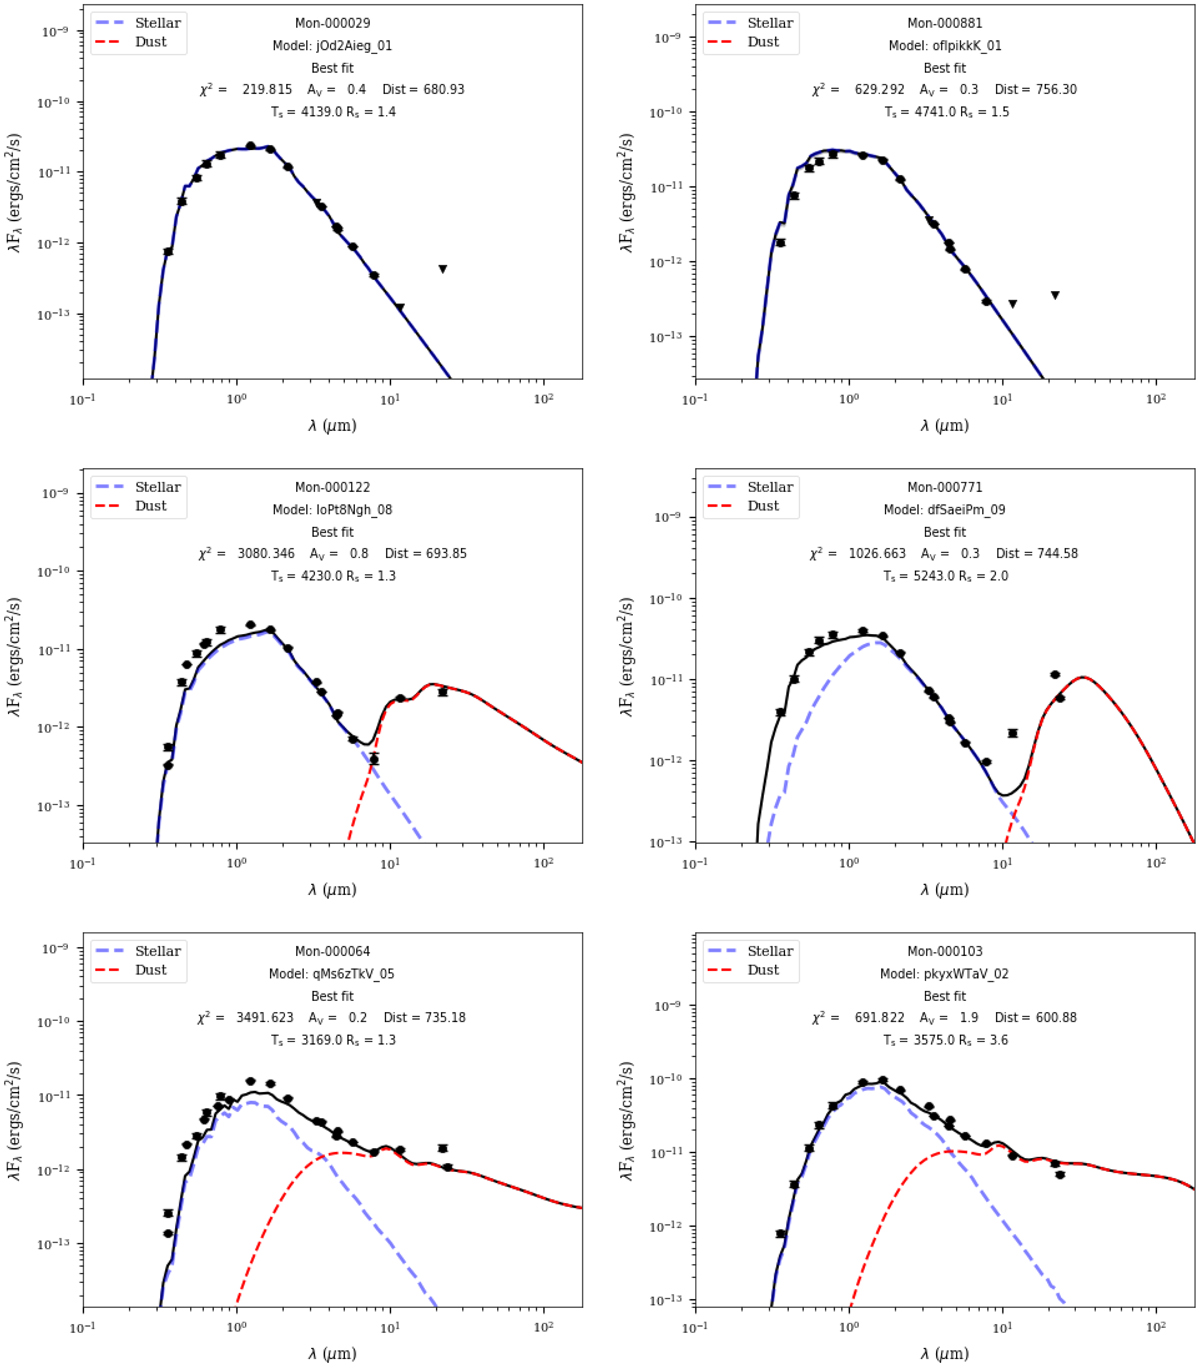
Examples of synthetic SED fitting, using Hyperion SED code (Robitaille 2017), for our sample of systems classified as diskless stars (top), transition disk candidates (middle) and full disk systems (bottom). The circles show data from the U band (0.3 μm) to the MIPS 24 μm band. Triangles, when present, represent the upper limits. The black solid line is the best fit to the SED (Robitaille 2017) and the dashed lines correspond to the stellar (blue) and dust (red) emission components (Robitaille 2011). We found in our sample 7% transition disk candidates, 52% systems with full disks, and 41% diskless stars.
Current usage metrics show cumulative count of Article Views (full-text article views including HTML views, PDF and ePub downloads, according to the available data) and Abstracts Views on Vision4Press platform.
Data correspond to usage on the plateform after 2015. The current usage metrics is available 48-96 hours after online publication and is updated daily on week days.
Initial download of the metrics may take a while.