Fig. A.1.
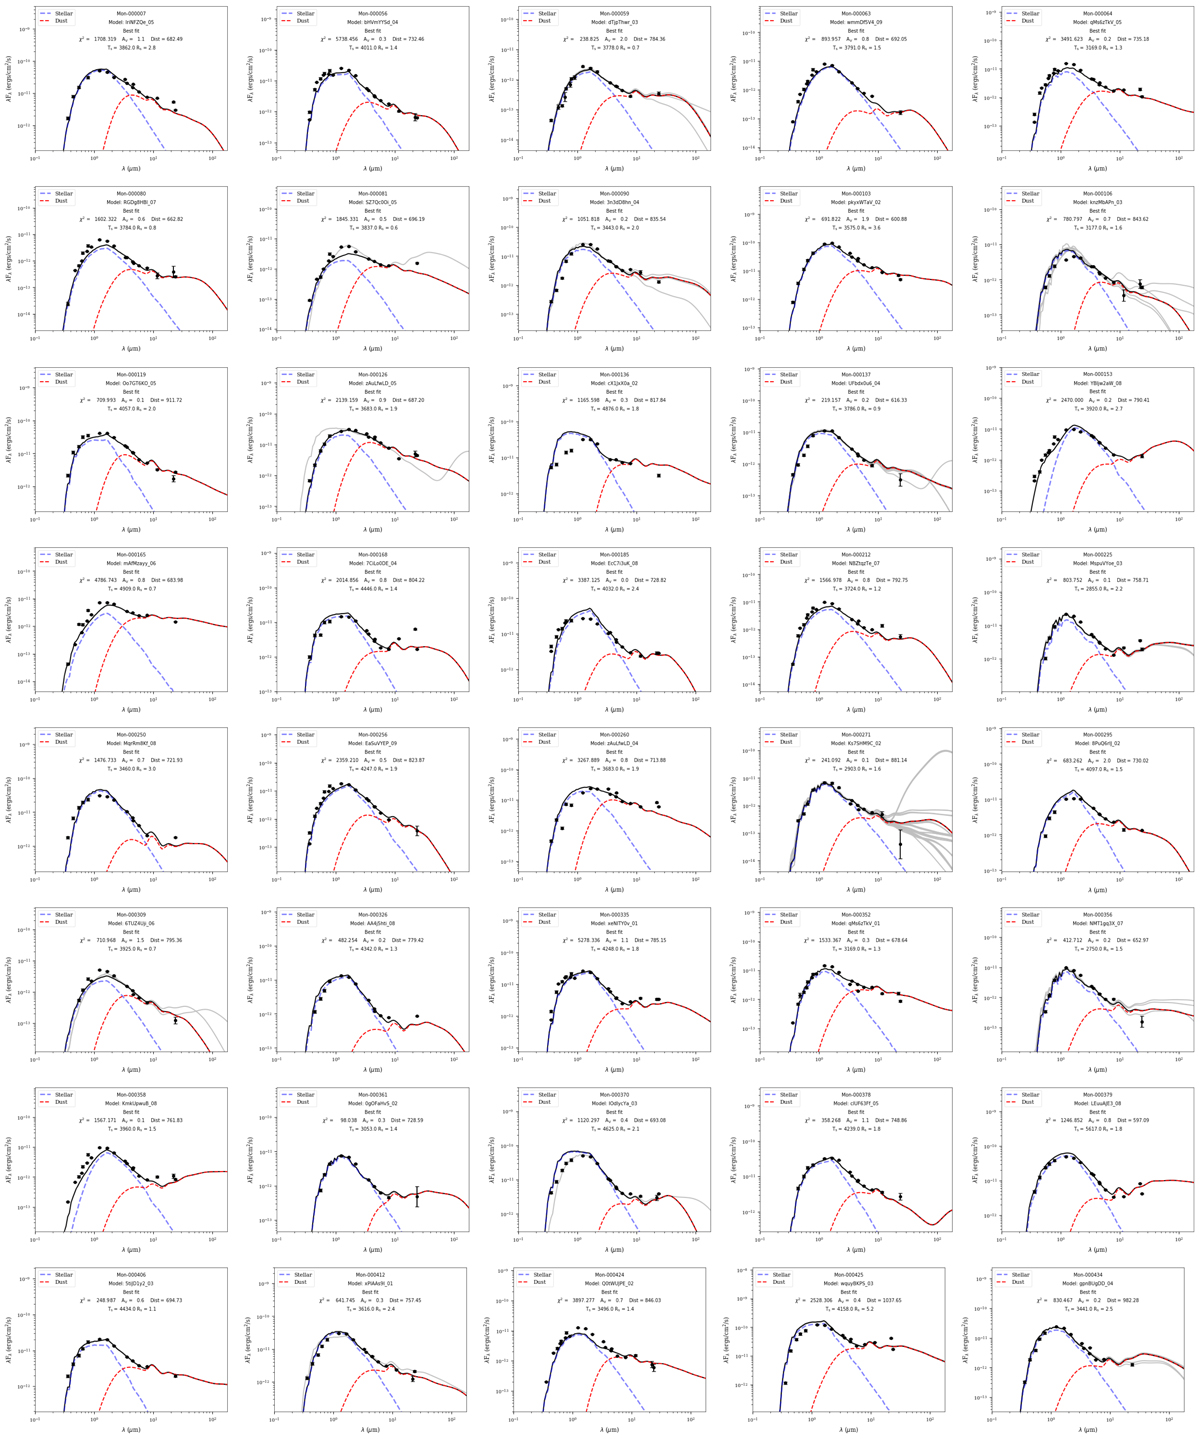
Spectral energy distribution of systems classified as full disks. The circles show data from the U band (0.3 μm) to the MIPS 24 μm band. The black solid line is the best fit to the SED (Robitaille 2017) and the dashed lines correspond to the stellar (blue) and dust (red) emission components (Robitaille 2011). The gray solid lines are all the model with ![]() , where ndata is the number of available data points from the literature, following Robitaille (2017). All these systems were observed by Spitzer at 24 μm and/or WISE at 22 μm.
, where ndata is the number of available data points from the literature, following Robitaille (2017). All these systems were observed by Spitzer at 24 μm and/or WISE at 22 μm.
Current usage metrics show cumulative count of Article Views (full-text article views including HTML views, PDF and ePub downloads, according to the available data) and Abstracts Views on Vision4Press platform.
Data correspond to usage on the plateform after 2015. The current usage metrics is available 48-96 hours after online publication and is updated daily on week days.
Initial download of the metrics may take a while.