Fig. 14.
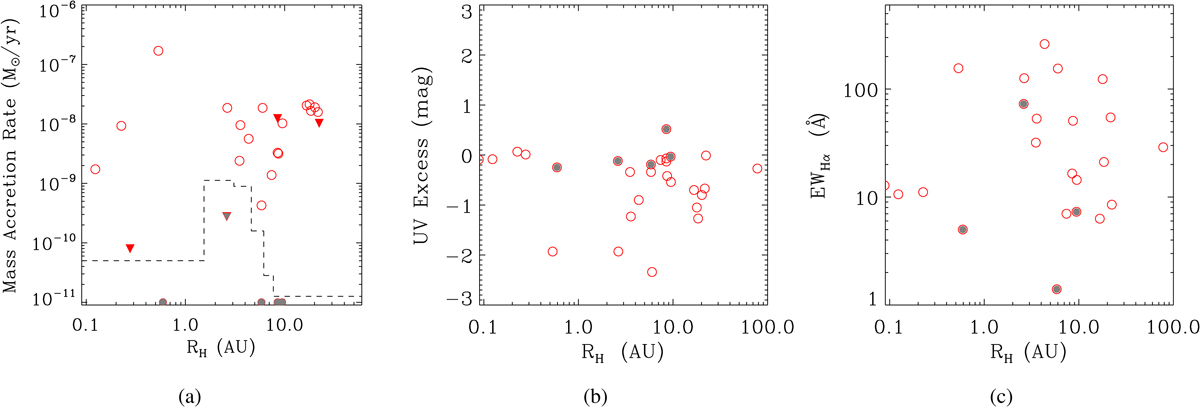
Accretion diagnostic as a function of disk hole size for transition disk candidates. (a) Mass accretion rates are from UV excess (preferentially) (Venuti et al. 2014) and from Hα equivalent width (Sousa et al. 2016). For WTTS, we fix the value of the mass accretion rate at 1 × 10⁻¹¹ M⊙ yr−1. The upside down triangles correspond to the upper limits of the mass accretion rate. The dashed line represents the region where the inner hole can be explained by X-ray photoevaporation (Owen et al. 2011, 2017). Only ∼18% of our sample of transition disk candidates can be explained by X-ray photoevaporation of the inner disk by stellar radiation. (b) UV emission excess (Venuti et al. 2014). (c) Hα equivalent width (Sousa et al. 2016; Dahm & Simon 2005). Gray filled symbols identify systems that fall in the region where the inner disk hole can be explained by X-ray photoevaporation.
Current usage metrics show cumulative count of Article Views (full-text article views including HTML views, PDF and ePub downloads, according to the available data) and Abstracts Views on Vision4Press platform.
Data correspond to usage on the plateform after 2015. The current usage metrics is available 48-96 hours after online publication and is updated daily on week days.
Initial download of the metrics may take a while.