Fig. 1.
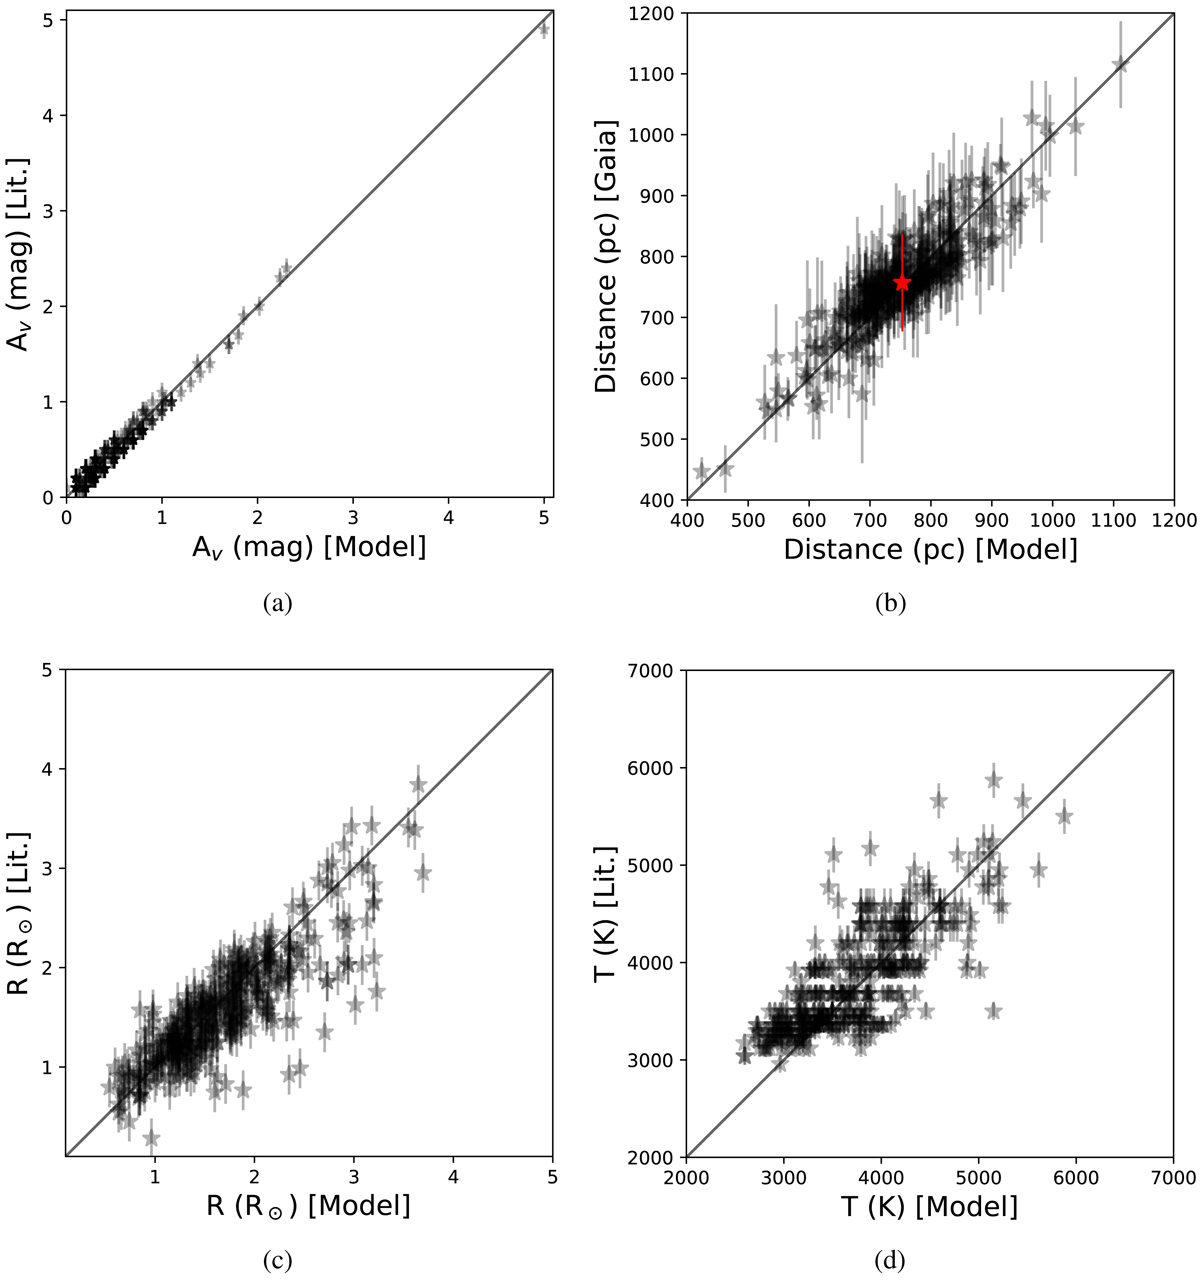
Stellar parameters modeled with Hyperion SED fitting code (Robitaille 2017) compared to stellar parameters obtained by Venuti et al. (2014). (a) AV, (b) distance from the Sun. The red point and error bars represent the mean and standard deviation of the distance of the cluster members studied in this work (d = 757 ± 80 pc), (c) stellar radii, (d) stellar temperatures. AV and distances are input parameters of the code, while stellar radius and temperature are output parameters of the Hyperion SED Model. The distances were obtained from the Gaia parallax data (Luri et al. 2018). The solid line shows a slope equal to 1. Based on these plots, we conclude that our modeling is doing at least as well as the prior Venuti et al. (2014) modeling.
Current usage metrics show cumulative count of Article Views (full-text article views including HTML views, PDF and ePub downloads, according to the available data) and Abstracts Views on Vision4Press platform.
Data correspond to usage on the plateform after 2015. The current usage metrics is available 48-96 hours after online publication and is updated daily on week days.
Initial download of the metrics may take a while.