Fig. 2.
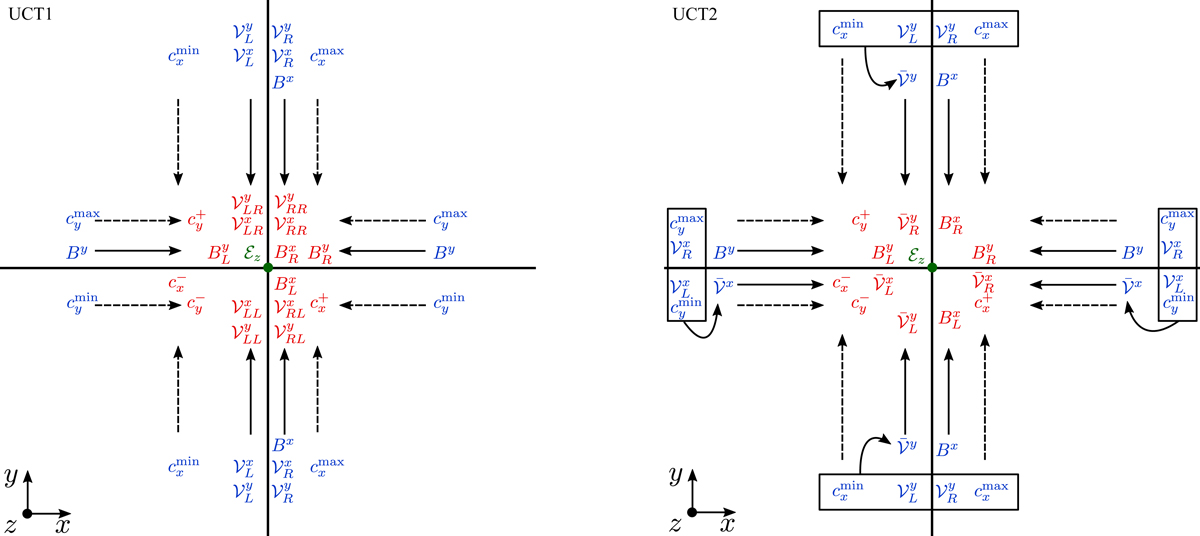
Reconstruction of quantities for UCT1 (left) and UCT2 (right). Quantities in blue are defined at cell faces in x and y and quantities in red at the cell edge in z. The resulting line integral of the electric field ℰz over the edge is shown in green. Continuous arrows represent limited reconstructions (steps 2 and 3 of UCT1, and 3 of UCT2) and dashed lines the choice of the maximum value (step 5 of UCT1 and 4 of UCT2, the labels L and R for the characteristic speeds are omitted in the figure to avoid saturation). The average transverse transport velocities needed in UCT2 (step 2) ![]() are computed using the quantities in the boxes.
are computed using the quantities in the boxes.
Current usage metrics show cumulative count of Article Views (full-text article views including HTML views, PDF and ePub downloads, according to the available data) and Abstracts Views on Vision4Press platform.
Data correspond to usage on the plateform after 2015. The current usage metrics is available 48-96 hours after online publication and is updated daily on week days.
Initial download of the metrics may take a while.