Fig. 15.
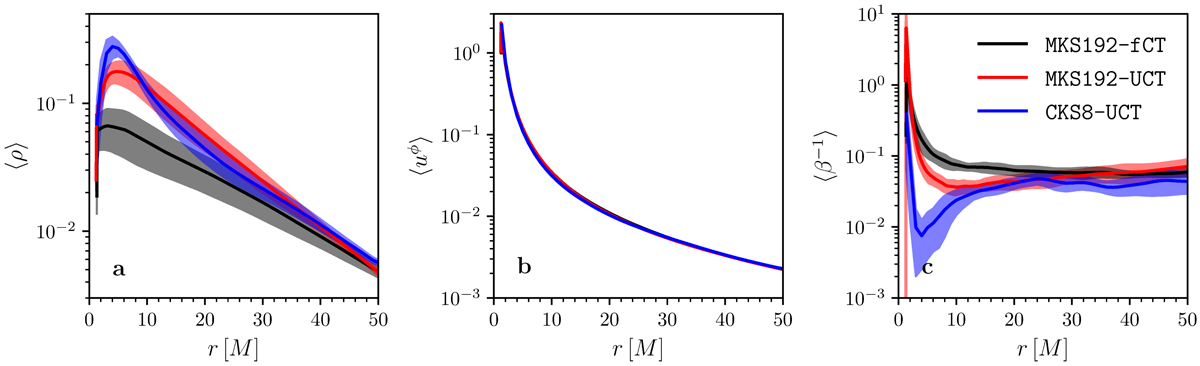
Disk- and time-averaged profiles of rest mass density (a), ϕ-component of the 4-velocity (b), and inverse plasma β (c), in the interval 5000−10 000 M, for the 3D simulations of magnetized accretion referred to in this work (see Table 2). Shaded regions show the standard deviation from the average value for each simulation. (These are, however, hardly noticeable for uϕ due the small standard deviation and the excellent agreement between the three curves.) After taking into account the different numerical methods and coordinates employed, the three simulations show reasonably consistent profiles, with the deviations in density and plasma β at rKS < 10 M for simulation CKS8-UCT probably caused by a poor resolution of the MRI in that region (see also Fig. 16).
Current usage metrics show cumulative count of Article Views (full-text article views including HTML views, PDF and ePub downloads, according to the available data) and Abstracts Views on Vision4Press platform.
Data correspond to usage on the plateform after 2015. The current usage metrics is available 48-96 hours after online publication and is updated daily on week days.
Initial download of the metrics may take a while.