Fig. A.1
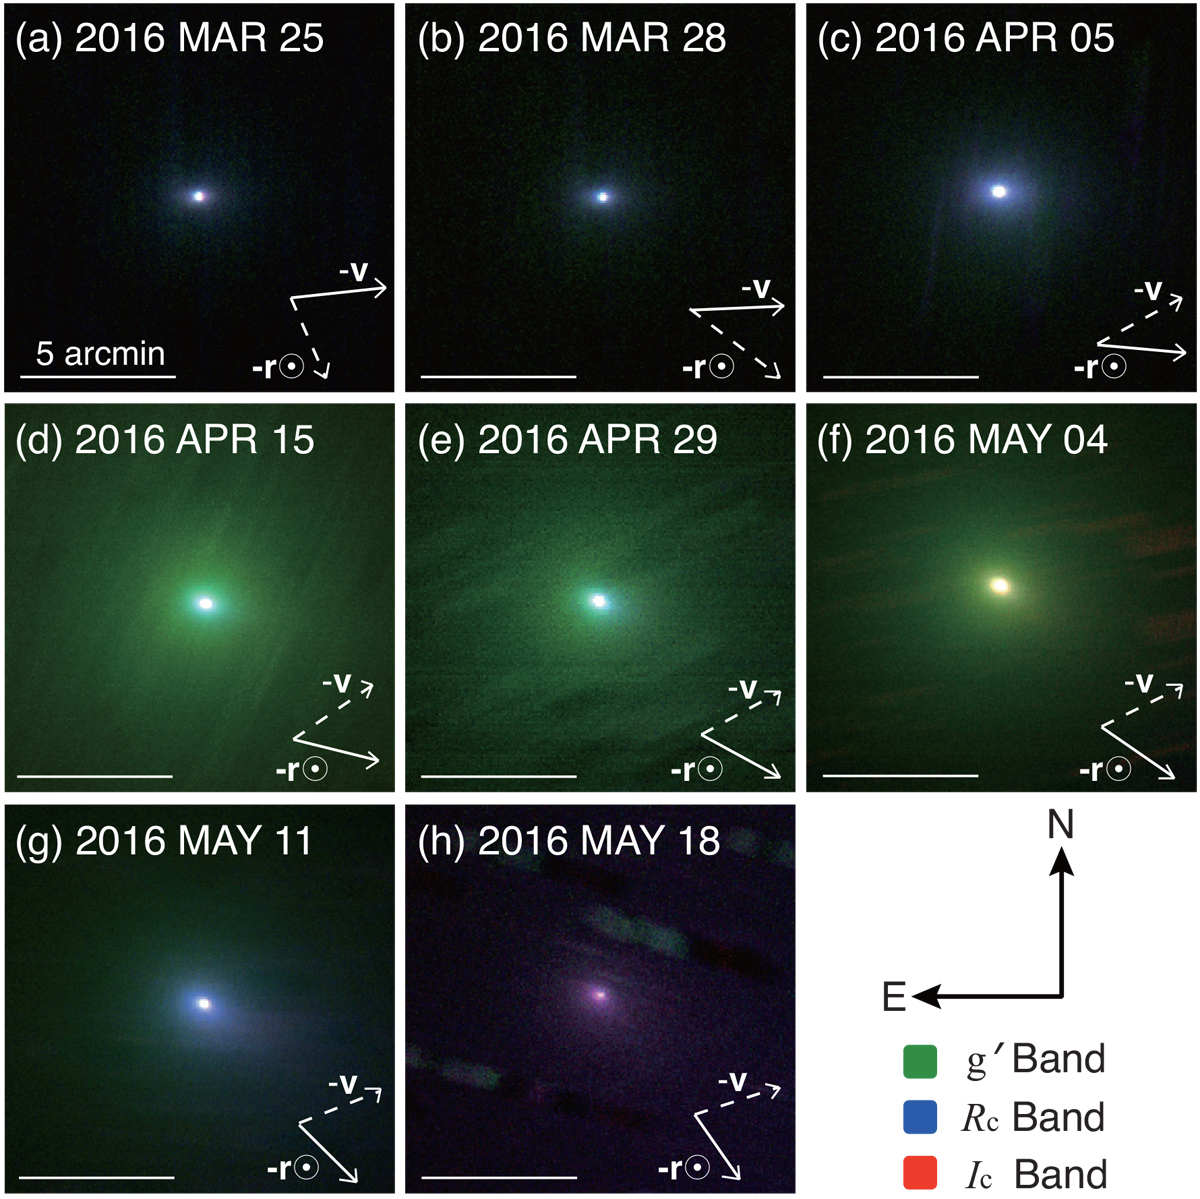
Wide-field composite images of 252P from the multiband OAO data. In each panel, the observation date and 5′ scale bar are given at the top and bottom left, respectively. Denotations of arrows are identical with those in Fig. 2. North is up, and east is to the left. Green, blue, and red hues represent the fluxes in the g′, RC, and IC bands, respectively. We note that the applied photometric aperture size of 1000 km in radius during this period decreased from 33.6′′ to 2.5′′, which is much smaller than the field of view of each panel.
Current usage metrics show cumulative count of Article Views (full-text article views including HTML views, PDF and ePub downloads, according to the available data) and Abstracts Views on Vision4Press platform.
Data correspond to usage on the plateform after 2015. The current usage metrics is available 48-96 hours after online publication and is updated daily on week days.
Initial download of the metrics may take a while.