Fig. 7
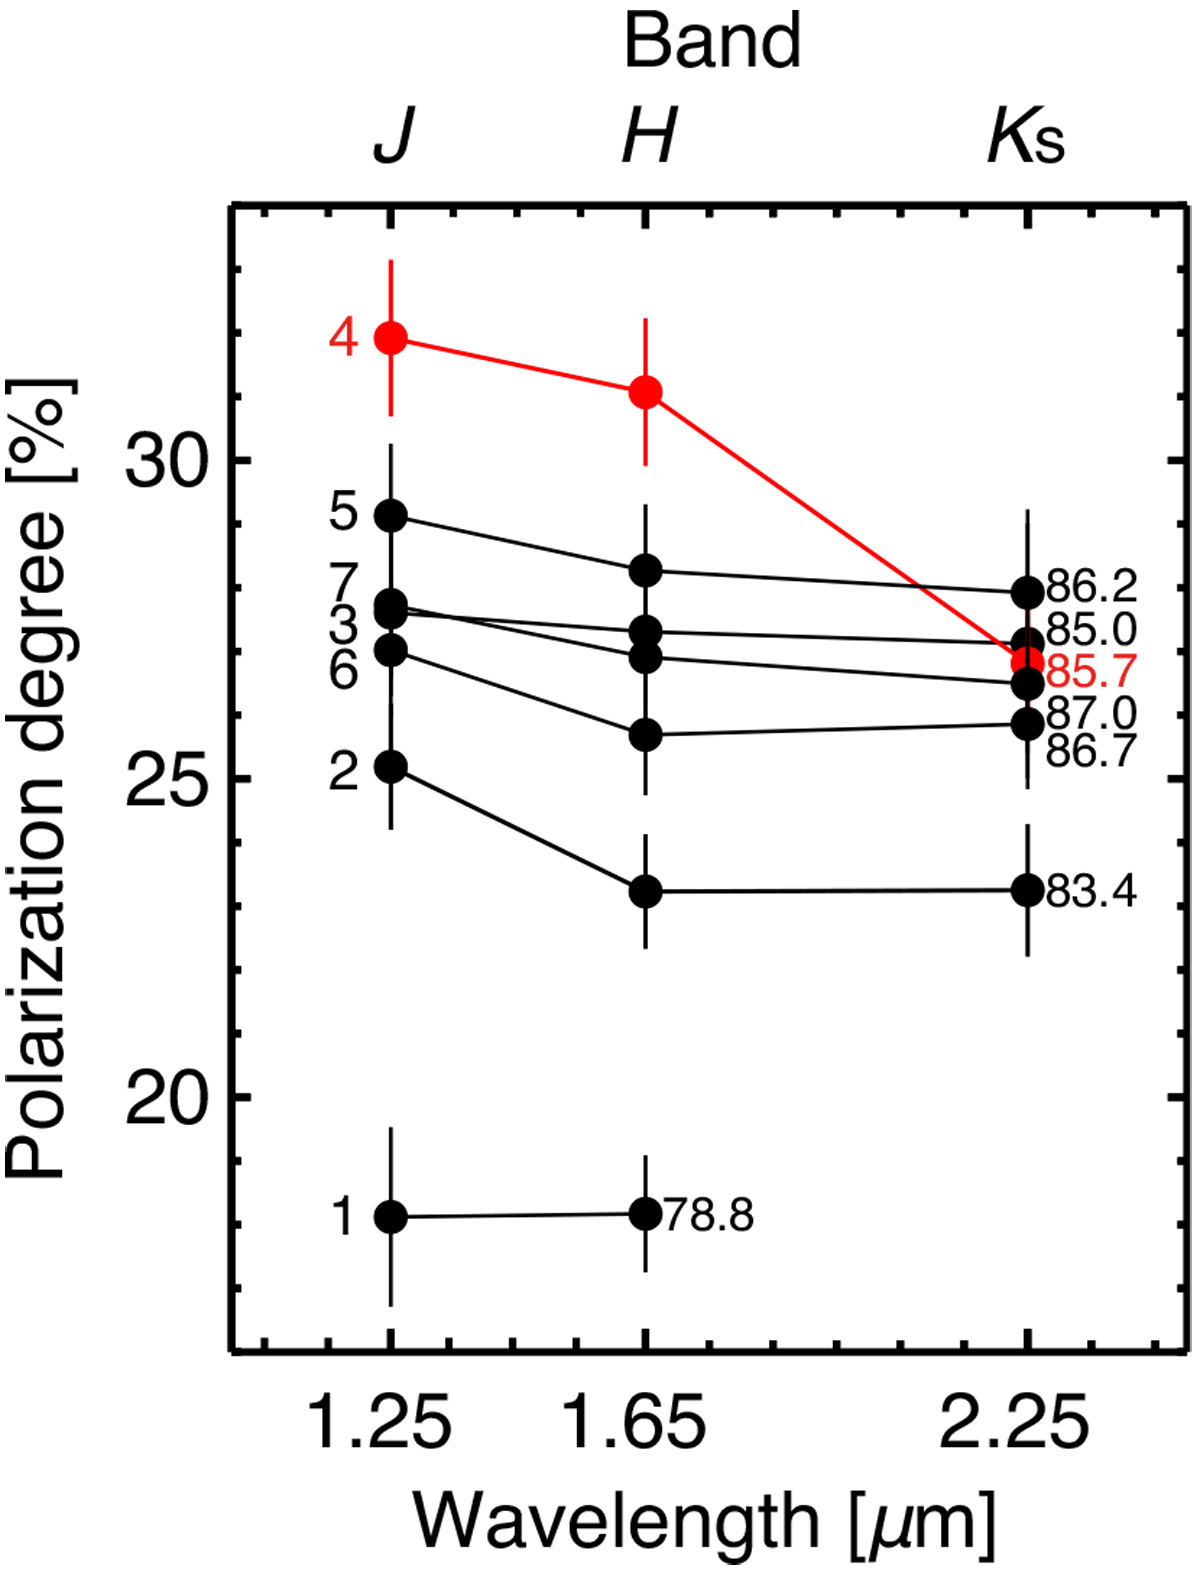
Pr of 252P from the IRSF data (Table 1) as a function of the wavelength. The numbers on the left side of the data indicate the order of the observation epochs (1: March 04, 2: March 09, 3: March 11, 4: March 12, 5: March 13, 6: March 14, and 7: March 15), and the numbers on the right side are the phase angles of the corresponding epochs. Red on the fourth epoch (March 12) denotes the day when the comet shows the maximum NIR brightness (open circles in Fig. 1a).
Current usage metrics show cumulative count of Article Views (full-text article views including HTML views, PDF and ePub downloads, according to the available data) and Abstracts Views on Vision4Press platform.
Data correspond to usage on the plateform after 2015. The current usage metrics is available 48-96 hours after online publication and is updated daily on week days.
Initial download of the metrics may take a while.