Fig. 2
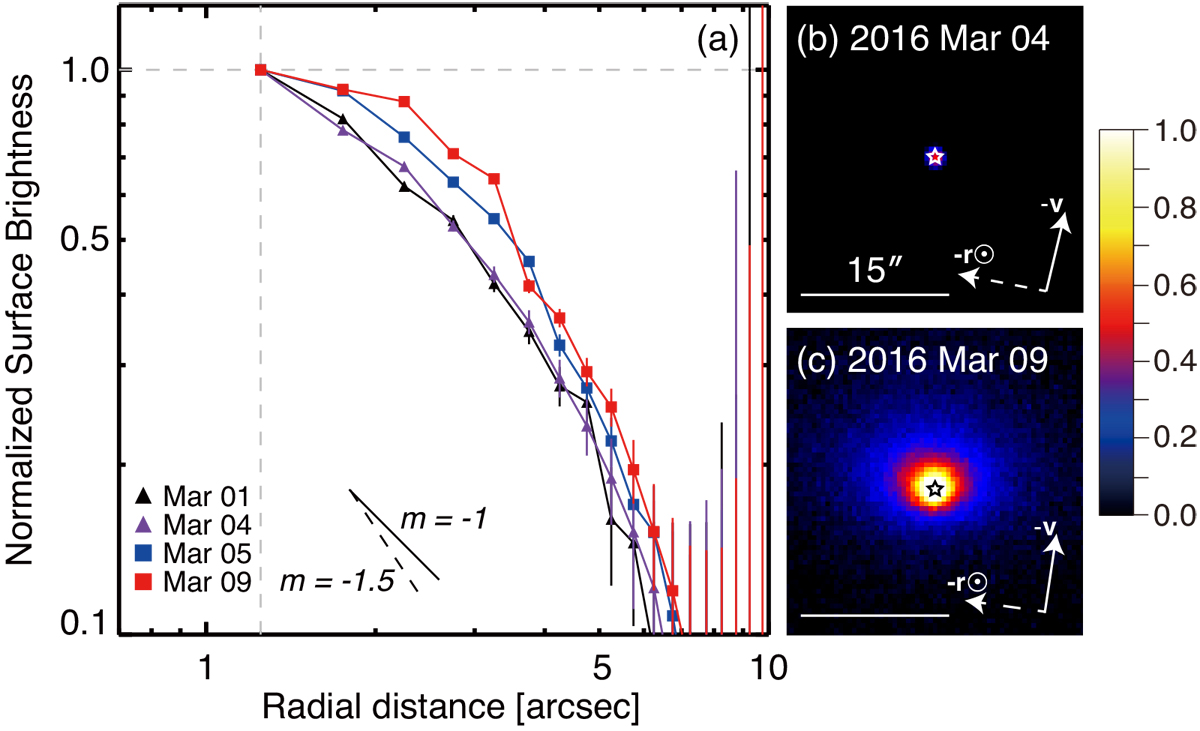
Azimuthally averaged surface brightness profiles of 252P from the (a) LSGT (R band) and IRSF (H band; StokesI) data. All brightness points are normalized to the radial distance of 1.25′′. The black solid and dashed lines denote the gradients of m = −1 and m = −1.5, respectively, which are typical of cometary dust steadily expanding with initial ejection velocity under the solar radiation field (Jewitt & Meech 1987). 2 × 2 binned H-band images are shown, each of which are from (b) before and (c) after the first activation of 252P taken from IRSF. Brightness was normalized between 0 and 1. North is up, and east is to the left. The bottom solid lines scale with 15′′, and the dashed and solid arrows denote the antisolar (−r⊙) and negativevelocity (−v) vectors, respectively. Central stars mark the position of the nucleus.
Current usage metrics show cumulative count of Article Views (full-text article views including HTML views, PDF and ePub downloads, according to the available data) and Abstracts Views on Vision4Press platform.
Data correspond to usage on the plateform after 2015. The current usage metrics is available 48-96 hours after online publication and is updated daily on week days.
Initial download of the metrics may take a while.