Fig. B.1
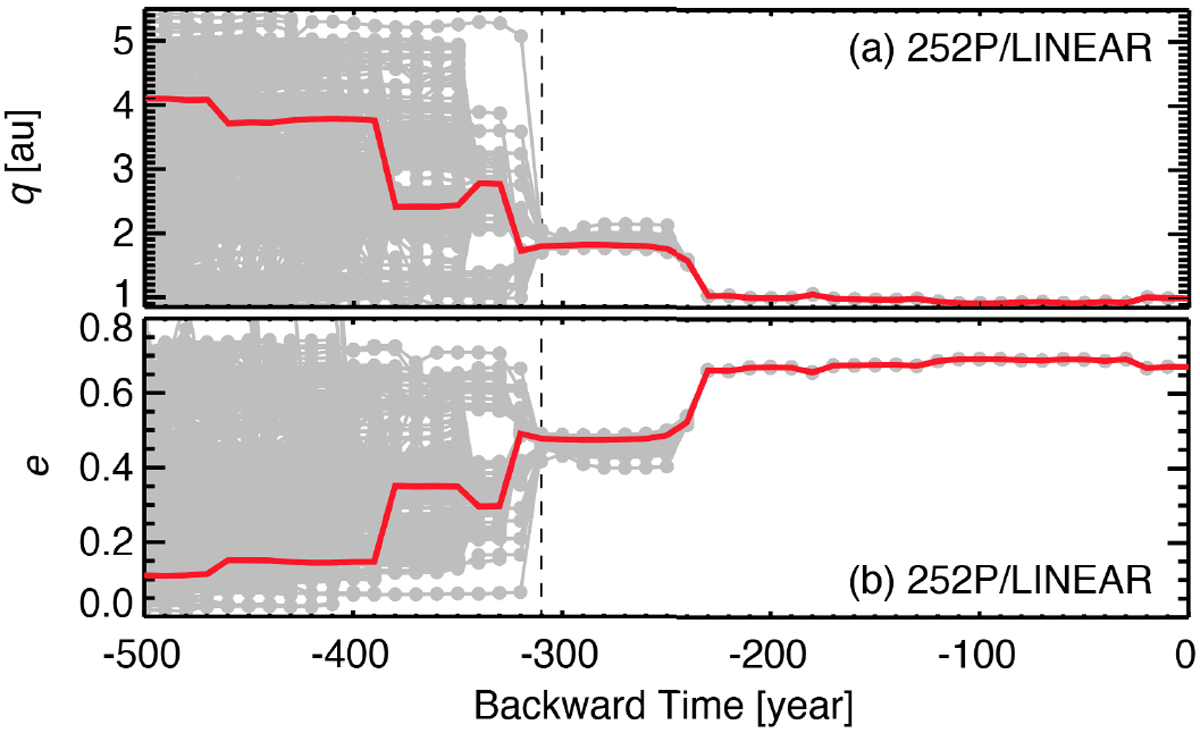
Time evolution of (a) the perihelion distance q and (b) the eccentricity e of 252P. Red lines denote the evolution of a particle with the average values at the epoch (May 11, 2016, the Julian date of 2 457 519.5), while each gray line represents that of an individual clone, the orbital elements of which follow 1σ standard deviation of the Gaussian distribution.
Current usage metrics show cumulative count of Article Views (full-text article views including HTML views, PDF and ePub downloads, according to the available data) and Abstracts Views on Vision4Press platform.
Data correspond to usage on the plateform after 2015. The current usage metrics is available 48-96 hours after online publication and is updated daily on week days.
Initial download of the metrics may take a while.