Fig. 1
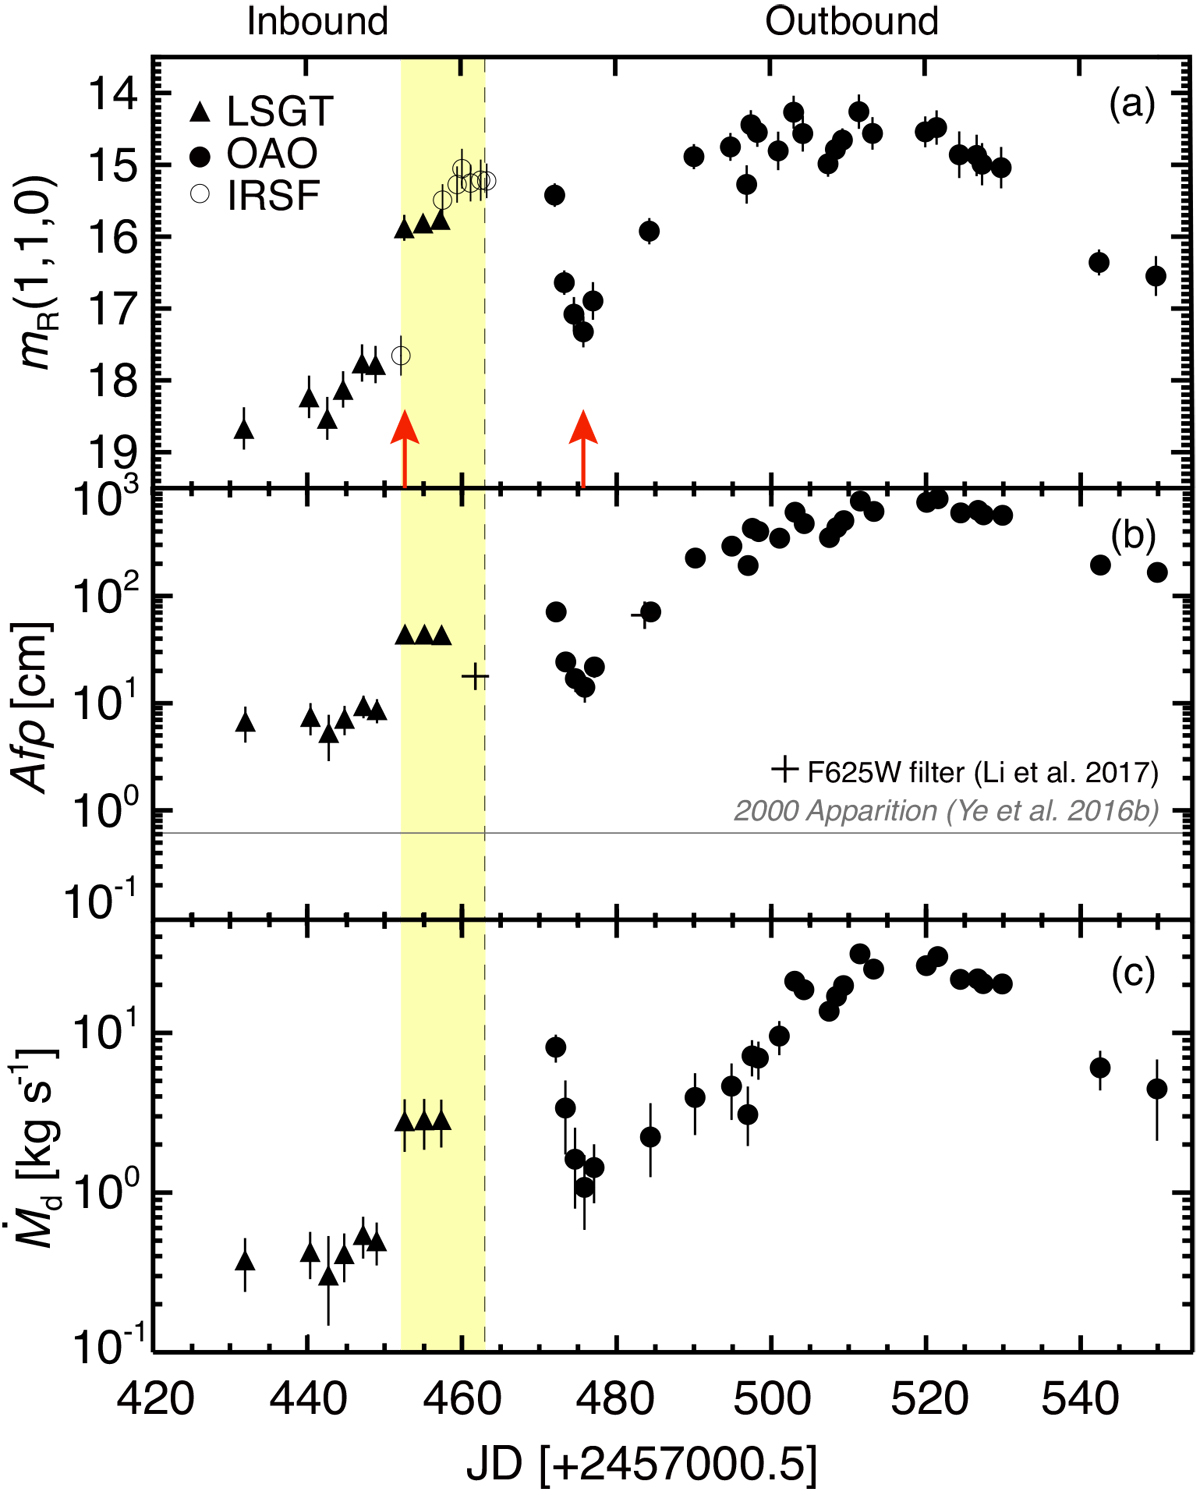
(a) Absolute magnitudes mR(1, 1, 0), (b) Afρ, and (c) dust mass-loss rate Ṁd of 252Pobserved from UT 2016 February 13 to June 10 with LSGT/SBIG ST-10 (filled triangles), OAO-50/MITSuME (filled circles), and IRSF/SIRPOL (open circles) are shown as a function of the Julian date (JD). The dashed vertical lines denote perihelion at rH = 0.996 au on UT 2016 March 15.28. The two arrows in panel a indicate the presumed locations where 252P presented significant brightness enhancements. In panel b the horizontal line of Afρ = 0.6 denotes the median Afρ value of the comet in the 2000 apparition (Ye et al. 2016b). The two crosses are from the Hubble Space Telescope data of Li et al. (2017) observed within the aperture radius of ≲10 km from the center in the F625W filter. The shaded area (in yellow) covers the epoch of our polarimetric observations.
Current usage metrics show cumulative count of Article Views (full-text article views including HTML views, PDF and ePub downloads, according to the available data) and Abstracts Views on Vision4Press platform.
Data correspond to usage on the plateform after 2015. The current usage metrics is available 48-96 hours after online publication and is updated daily on week days.
Initial download of the metrics may take a while.