Open Access
Fig. 6.
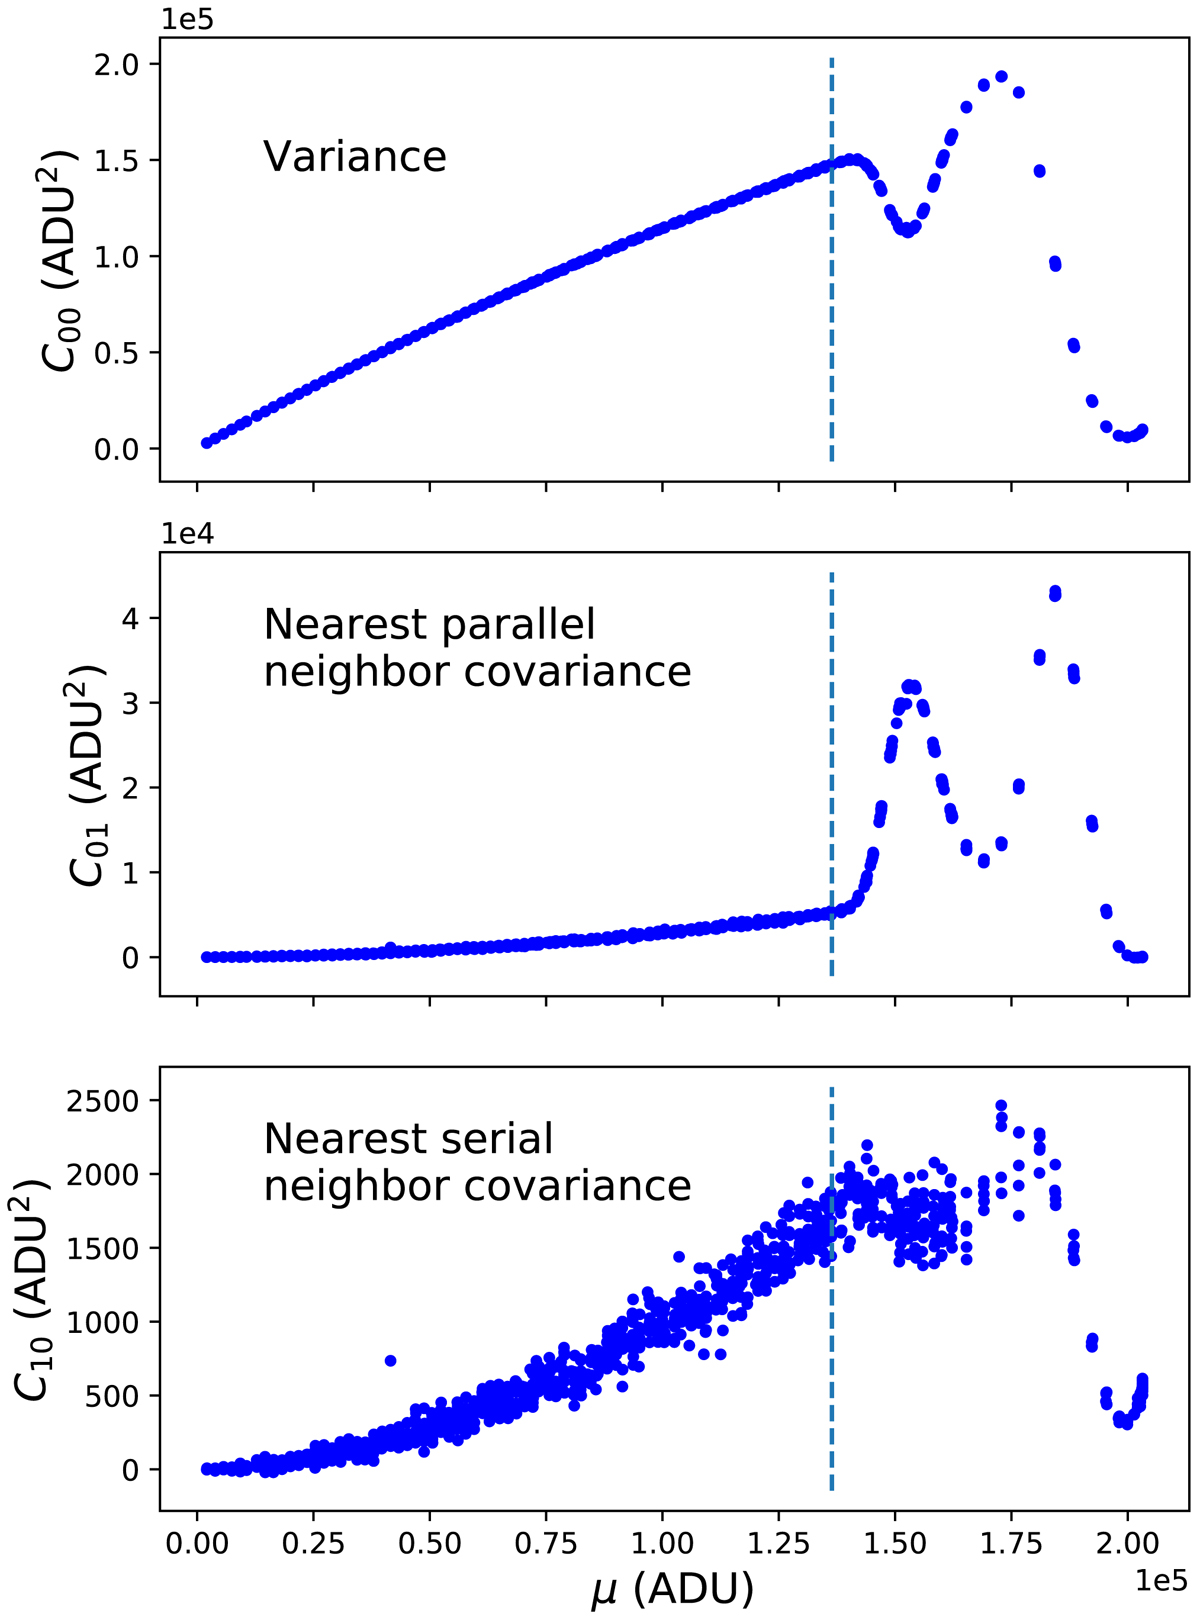
Variance and two nearest covariances as a function of flat field average, in order to illustrate the saturation level (in channel 0). The three curves change behavior around 1.5 × 10⁵ ADUs. The drawn fitting limit is about 10% below this value, and corresponds to 105 el, at a gain of 0.733.
Current usage metrics show cumulative count of Article Views (full-text article views including HTML views, PDF and ePub downloads, according to the available data) and Abstracts Views on Vision4Press platform.
Data correspond to usage on the plateform after 2015. The current usage metrics is available 48-96 hours after online publication and is updated daily on week days.
Initial download of the metrics may take a while.