Fig. 5.
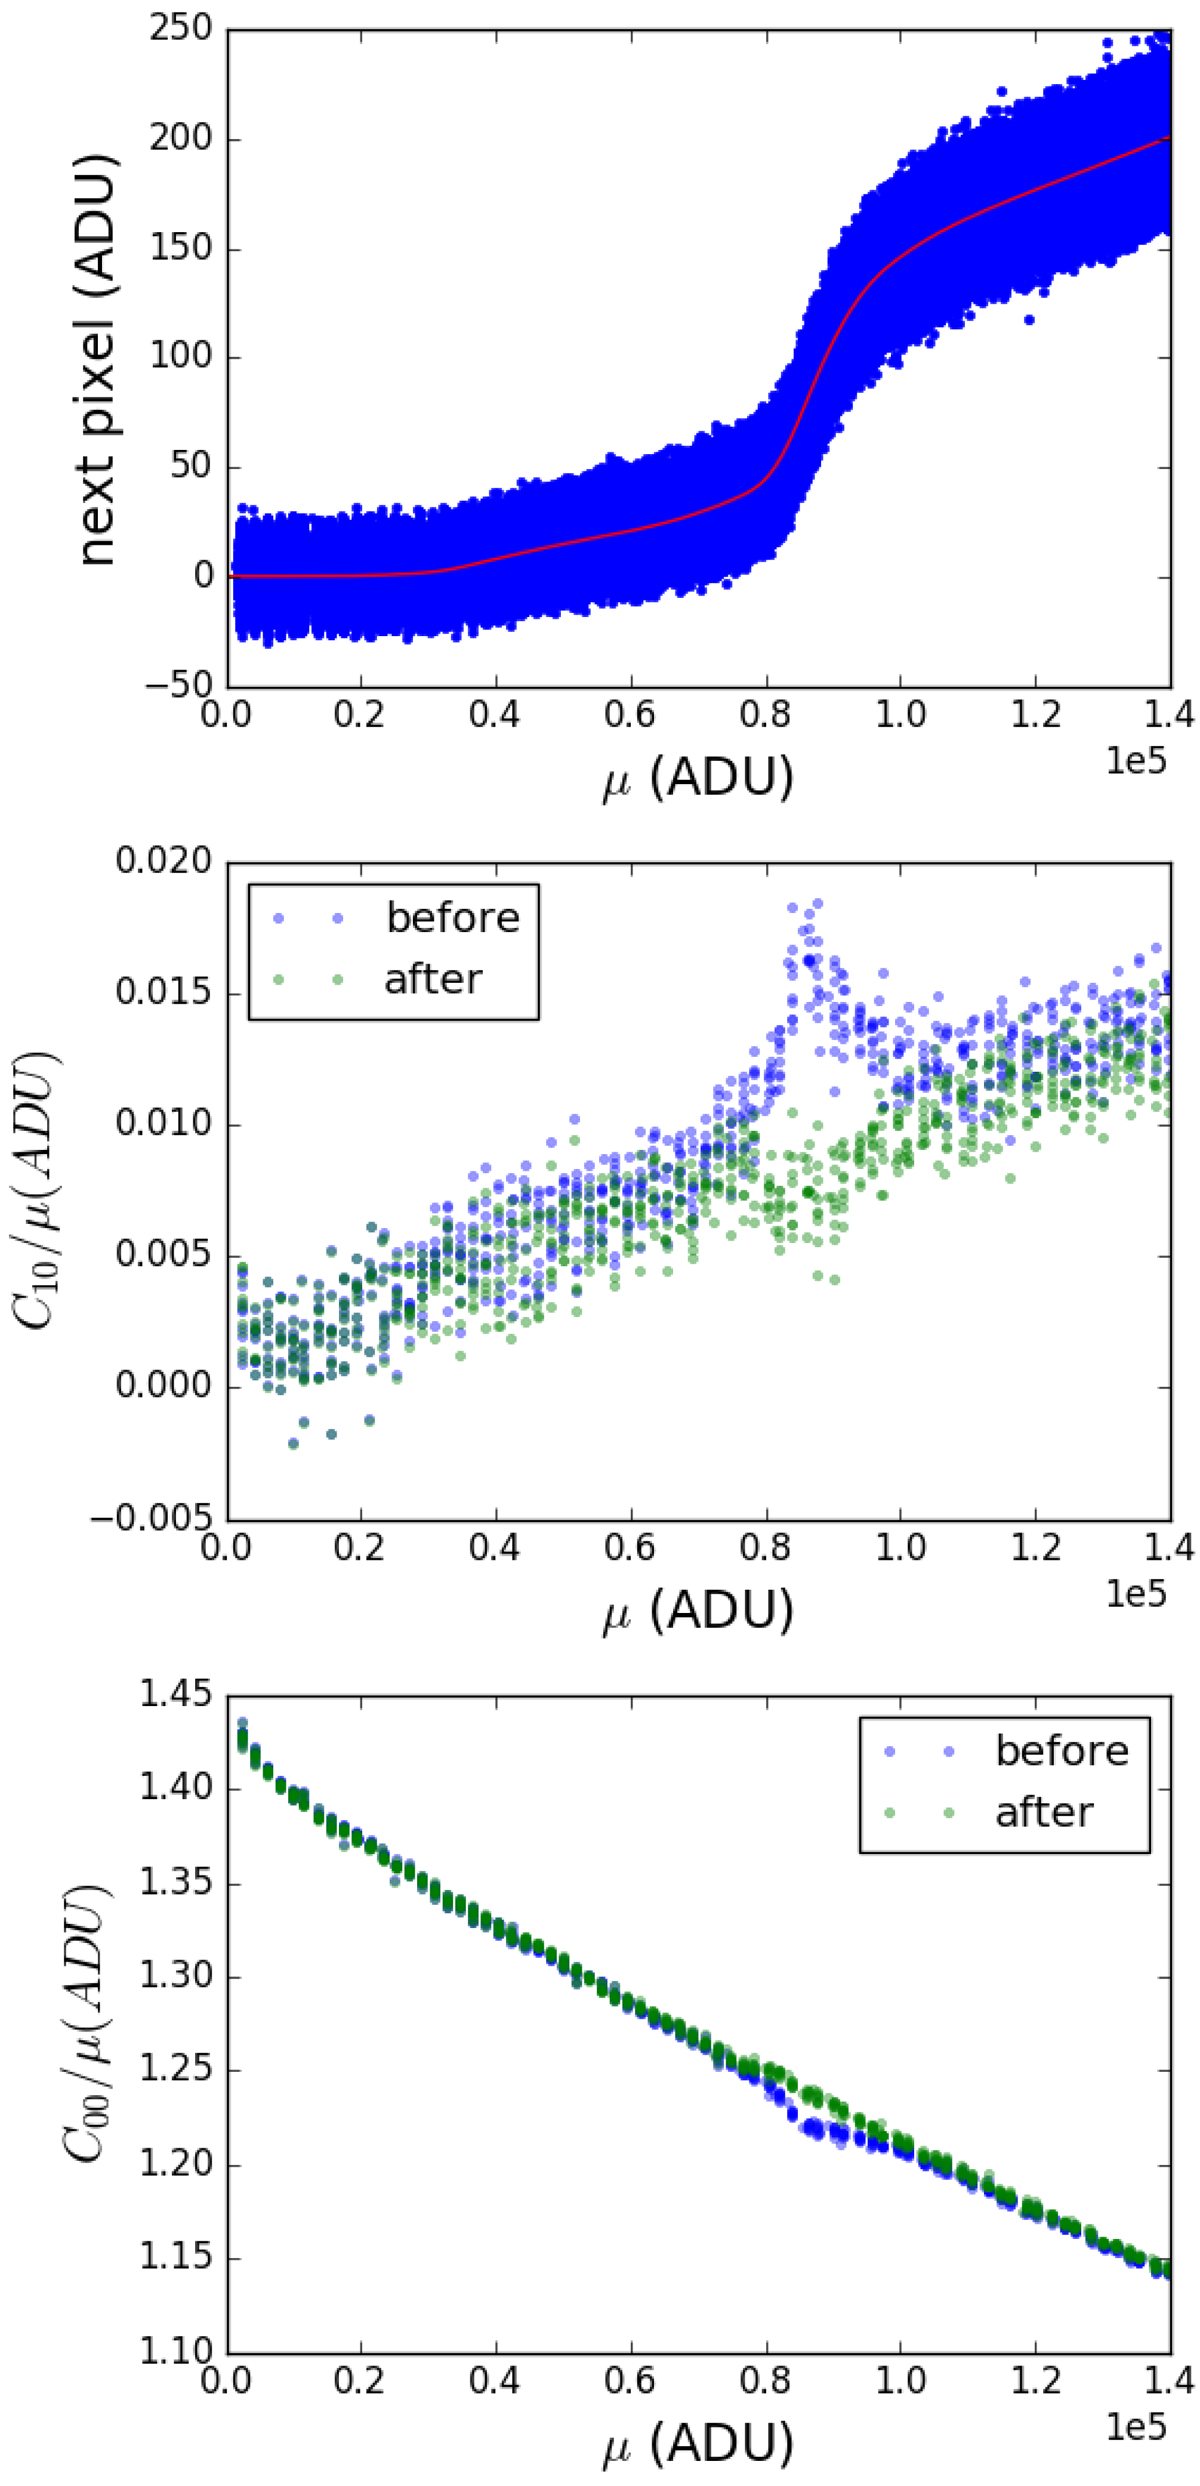
Deferred charge measurements, and effects on serial covariance and variance. The three plots refer to channel 10 only, after linearity correction. Top: content of the first serial overscan pixel as a function of flat level (data points and a spline fit). Middle: first serial correlation as a function of flat level, before and after placing the charge back, that is, before and after deferred charge correction. Bottom: same as middle, but for the variance. In Fig. 3, there is no obvious distortion of the variance curve after linearity correction because channel 8 is essentially free of deferred charge.
Current usage metrics show cumulative count of Article Views (full-text article views including HTML views, PDF and ePub downloads, according to the available data) and Abstracts Views on Vision4Press platform.
Data correspond to usage on the plateform after 2015. The current usage metrics is available 48-96 hours after online publication and is updated daily on week days.
Initial download of the metrics may take a while.