Fig. 11.
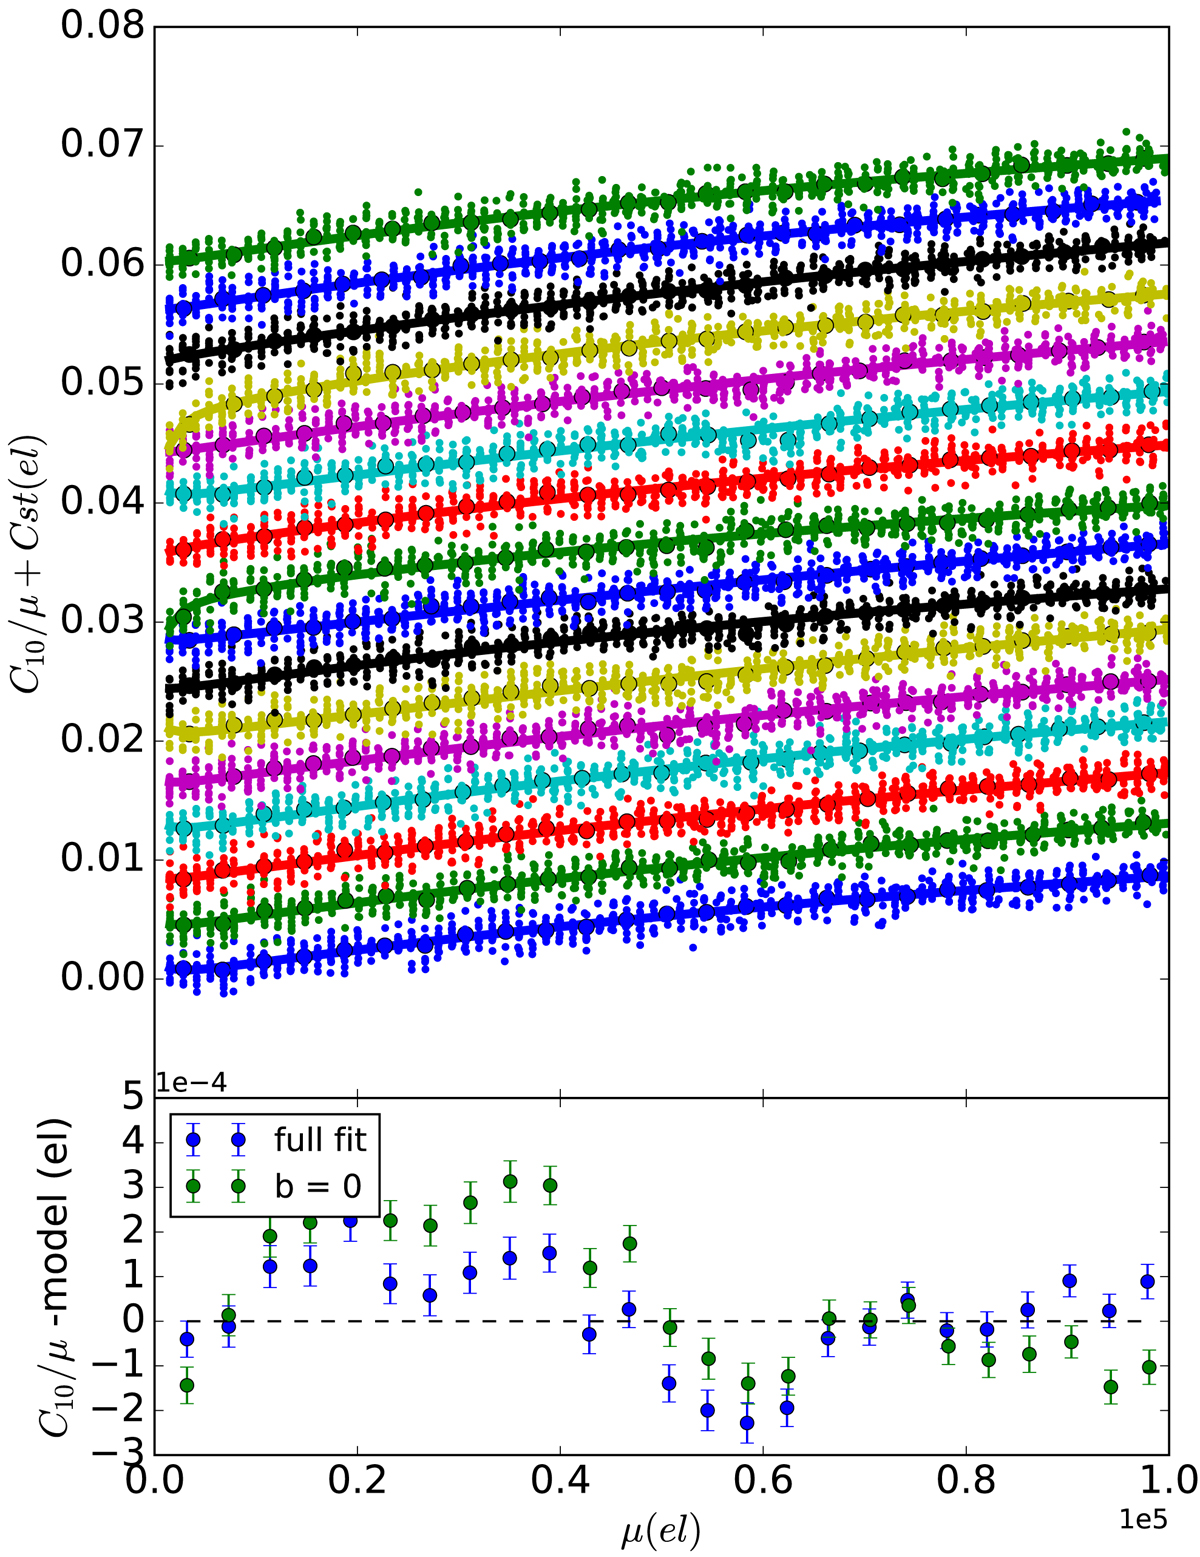
Fits of C10/μ as a function of μ for the 16 channels. In the top plot, the data and model (the full model of Eq. (20)) have been offset by 0.004 × c, where c is the channel number. We plot both individual measurements and averages at the same intensity, where the error bars reflect the scatter (compatible with the expected shot noise). The down turn at low flux of channels 8 and 12 is accommodated in the fit by the n10 term in the model Eq. (20). The bottom plot reports the binned average residuals to both fits.
Current usage metrics show cumulative count of Article Views (full-text article views including HTML views, PDF and ePub downloads, according to the available data) and Abstracts Views on Vision4Press platform.
Data correspond to usage on the plateform after 2015. The current usage metrics is available 48-96 hours after online publication and is updated daily on week days.
Initial download of the metrics may take a while.