Fig. A.1.
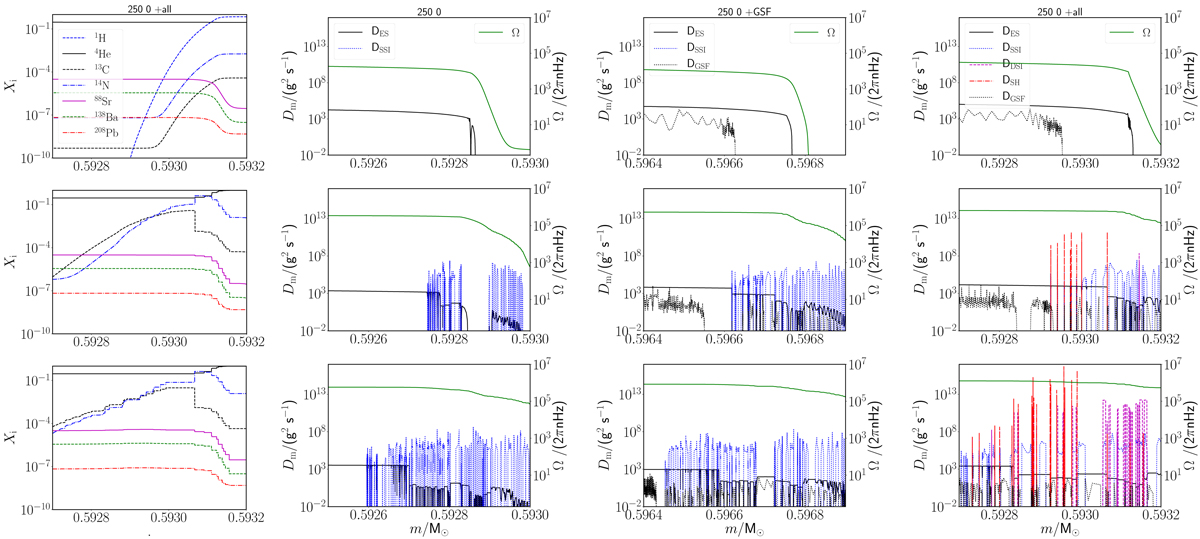
Abundance and diffusion plots showing the maximum extent of the TDU (top panels), the maximum 13C-pocket size (middle panels), and the start of the s-process production (bottom panels), matching the interpulse in which the fifth TDU takes place as in Fig. 3. We show the abundance profiles of a characteristic 13C-pocket in the most left panel, followed by the diffusion profiles of the “250 0”, “250 0 +GSF”, and the “250 0 +all” models respectively. The 13C-pockets in these models are widened when compared to the “250 5” model in Fig. 3 due to the ES circulation. Please note the changed range over which the diffusion coefficients are shown compared to Fig. 3.
Current usage metrics show cumulative count of Article Views (full-text article views including HTML views, PDF and ePub downloads, according to the available data) and Abstracts Views on Vision4Press platform.
Data correspond to usage on the plateform after 2015. The current usage metrics is available 48-96 hours after online publication and is updated daily on week days.
Initial download of the metrics may take a while.