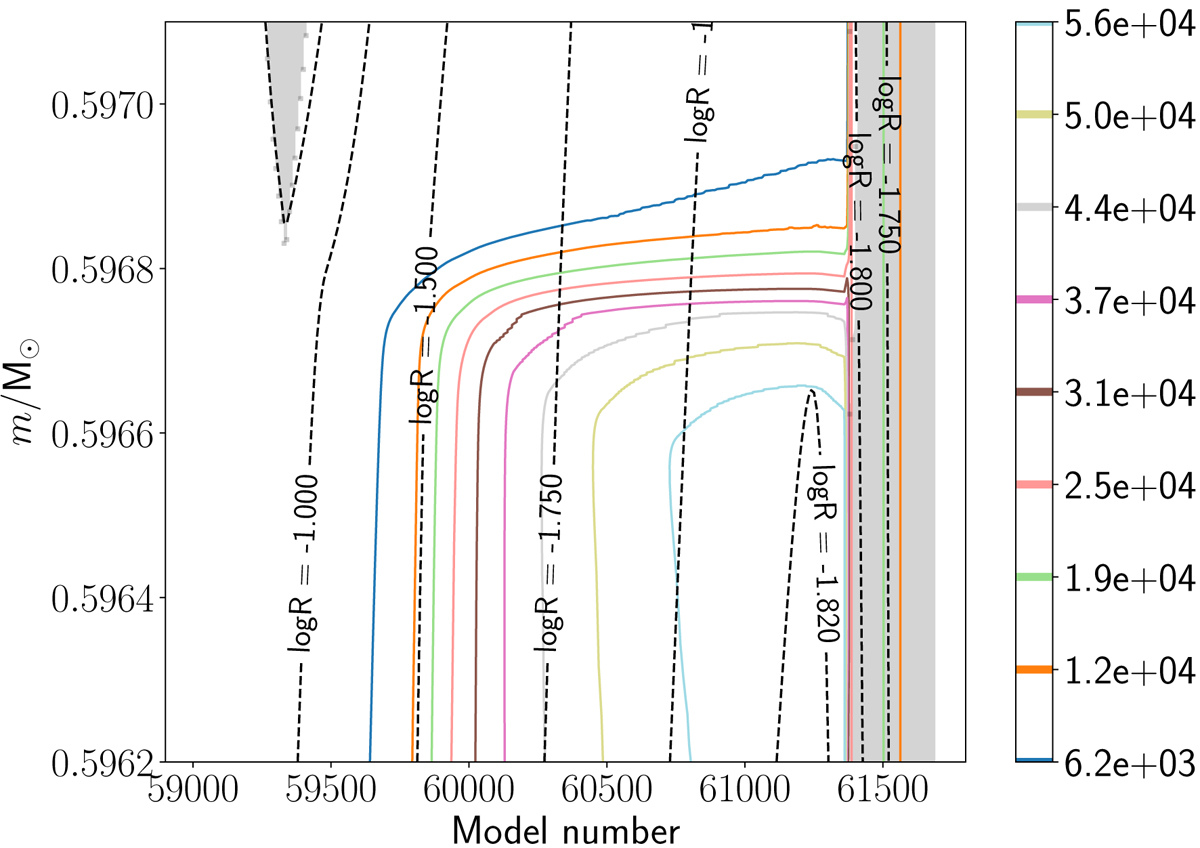
Fig. 4.

Time evolution of Ω. The Ω profile is taken from the interpulse of the “250 5” model that is shown in Fig. 3. Grey regions are the convective envelope during TDU (left) and the TP (right), dashed black contour lines show constant log10(r/R⊙), coloured contour lines show Ω values in linear range (the darker the contour line, the lower Ω). Model numbers 59 400, 60 000, and 60 500 correspond to the three time steps in Fig. 3, and the vertical axis of this figure corresponds to the horizontal axes of the “250 5” panels in Fig. 3. The contraction of the region leads to a steeper Ω gradient in the 13C-pocket region.
Current usage metrics show cumulative count of Article Views (full-text article views including HTML views, PDF and ePub downloads, according to the available data) and Abstracts Views on Vision4Press platform.
Data correspond to usage on the plateform after 2015. The current usage metrics is available 48-96 hours after online publication and is updated daily on week days.
Initial download of the metrics may take a while.


