Fig. 3.
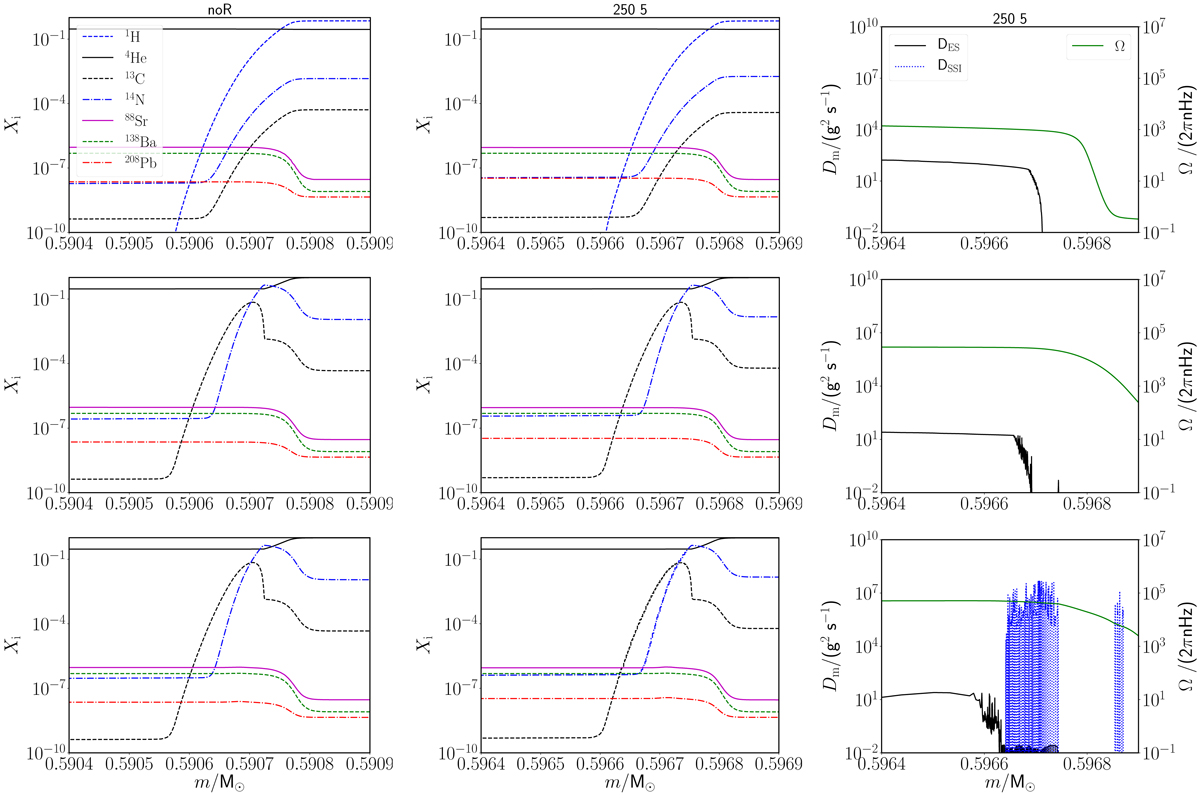
Abundance and diffusion profiles within 13C-pocket regions. These regions fall within the same interpulse period as the fifth TDU (from our MPPNP results). Left panels: abundance profiles of the non-rotating model, and middle and right panels: abundance and diffusion profiles of the “250 5” model. Top panels: maximum extent of the TDU, middle panels: maximum 13C-pocket size, and bottom panels: profiles when the s-process production has started. The influence of rotation on the 13C-pocket of the “250 5” is small, the only difference is that the abundance profiles are not as smooth as in the “noR” model.
Current usage metrics show cumulative count of Article Views (full-text article views including HTML views, PDF and ePub downloads, according to the available data) and Abstracts Views on Vision4Press platform.
Data correspond to usage on the plateform after 2015. The current usage metrics is available 48-96 hours after online publication and is updated daily on week days.
Initial download of the metrics may take a while.