Fig. 2.
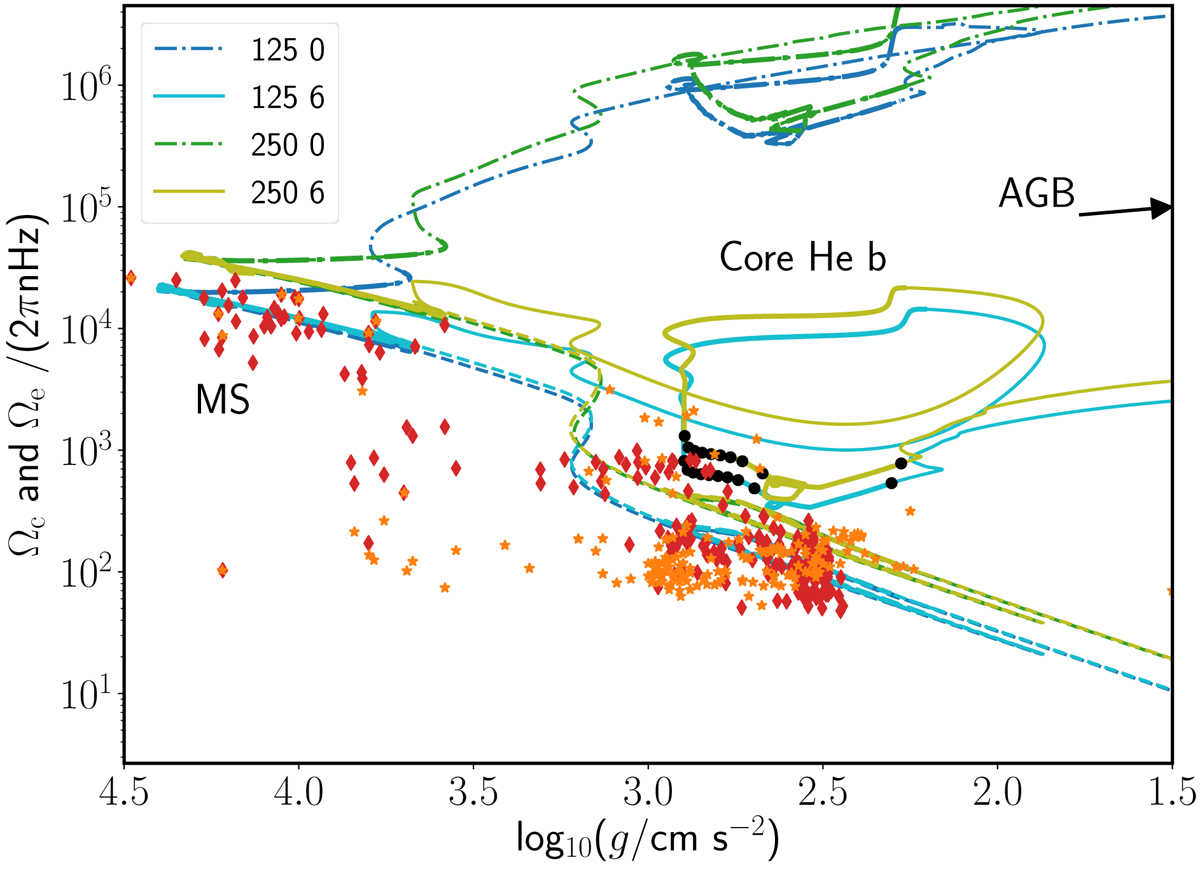
Evolution of core (Ωc) and surface rotation (Ωs) rates. Four of the models listed in Table 1 are shown here, and compared to asteroseismically obtained rotation rates. The observational data points are the core (red diamonds) and the surface (orange stars) rotation rates, taken from Mosser et al. (2012), Deheuvels et al. (2012, 2014, 2015), Ceillier et al. (2017), and the compilation of observed main-sequence stars from 12 other papers presented in Aerts et al. (2017). From these observational studies, we only select single stars in the mass range 1.4−3.0 M⊙. Typical error bars of these observations are of the order of the symbol size used. The solid and dot-dashed show the core rotation rates of the models with and without the additional viscosity respectively. The dashed lines show the envelope rotation rates of the models. The thick line segments correspond to the core burning phases, and the thin segments to the shell burning phases. The black dots indicate the time spend in the core He burning phase by the models with νadd ≠ 0, each spaced by 10% of the total duration starting at the 10% mark and ending with the 100% mark (the dots located on the most left and right, respectively). These dots show that these models spend most of their time during this evolutionary phase close to the observed rotation rates.
Current usage metrics show cumulative count of Article Views (full-text article views including HTML views, PDF and ePub downloads, according to the available data) and Abstracts Views on Vision4Press platform.
Data correspond to usage on the plateform after 2015. The current usage metrics is available 48-96 hours after online publication and is updated daily on week days.
Initial download of the metrics may take a while.