Fig. 9.
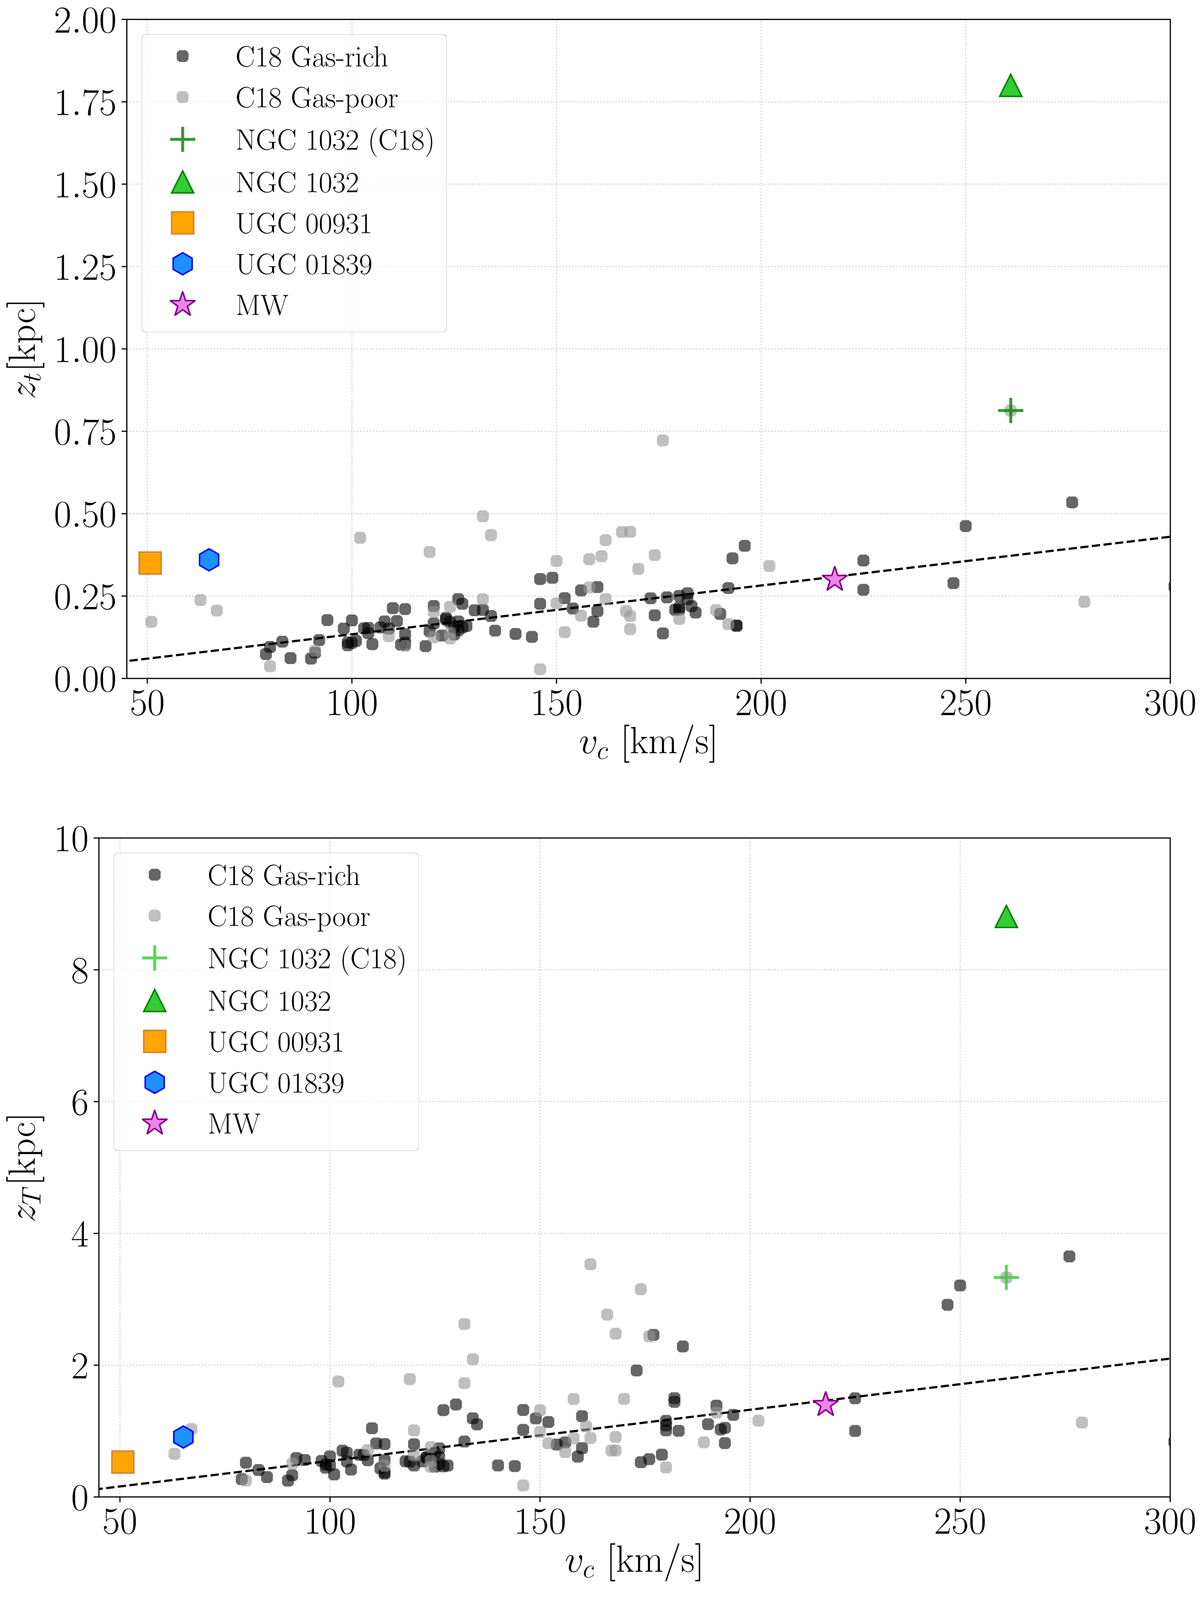
Thin- and thick-disc scale-heights (top and bottom panels, respectively) of the PSF-deconvolved model fit as a function of the circular velocity (vc) for the galaxies in our sample with circular velocity information (see Table 2). The stars represent the corresponding values for the Milky Way (scale heights from Gilmore & Reid 1983, and circular velocity from Bovy et al. 2012). The black dashed line corresponds to a robust linear regression to the gas-rich galaxies in Comerón et al. (2018). Overplotted are the values of Comerón et al. (2018), labelled C18.
Current usage metrics show cumulative count of Article Views (full-text article views including HTML views, PDF and ePub downloads, according to the available data) and Abstracts Views on Vision4Press platform.
Data correspond to usage on the plateform after 2015. The current usage metrics is available 48-96 hours after online publication and is updated daily on week days.
Initial download of the metrics may take a while.