Fig. 3.
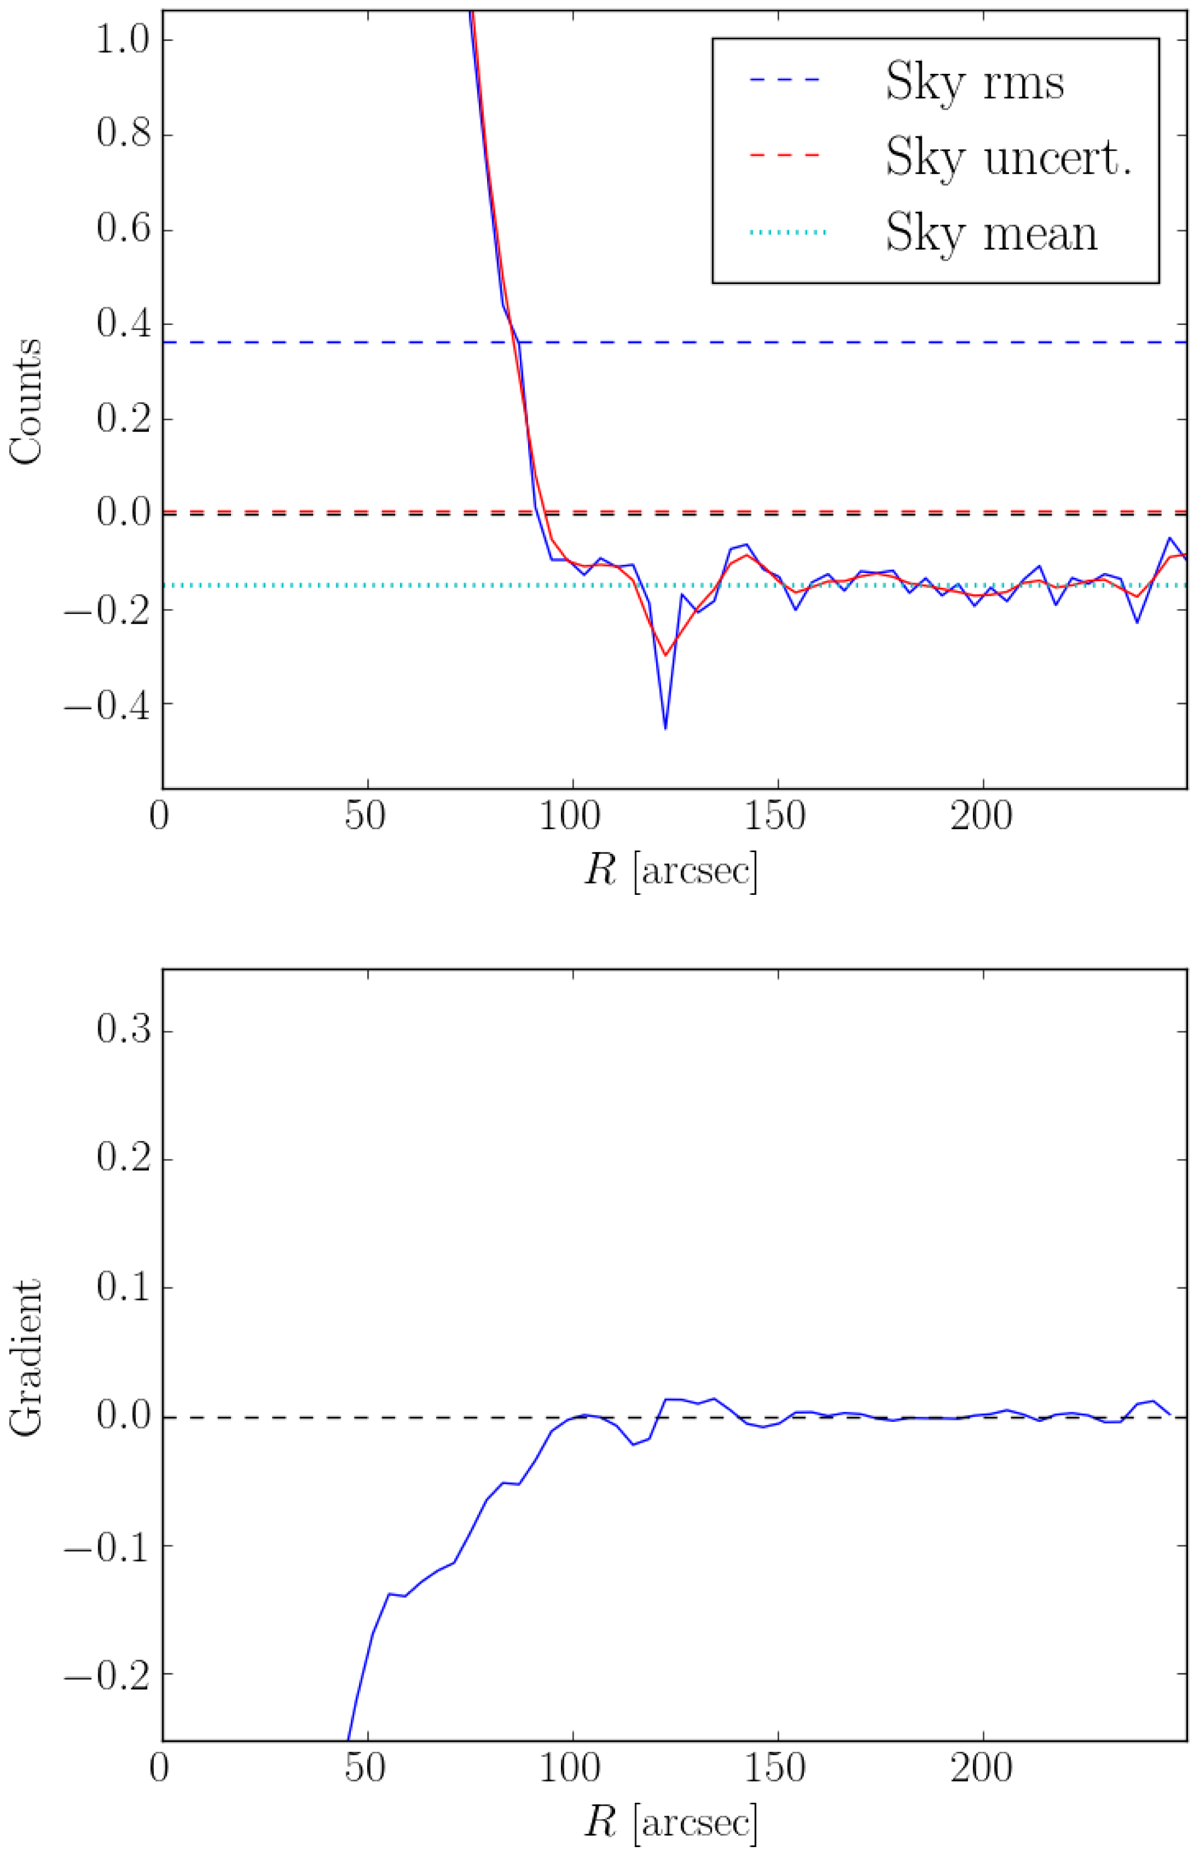
Sky subtraction for the edge-on galaxy UGC 01839 in the rdeep band of the IAC Stripe 82 Legacy Project data. Top: outer region of the very extended radial surface brightness profile of UGC 01839 (blue solid line). Overplotted is the same profile, but convolved with a one-dimensional Gaussian kernel of 1 pixel standard deviation (red solid line), the dashed lines represent the sky rms value (blue), the uncertainty of the whole background image (red), and the zero-count position (black); the mean sky value that we subtract from the image is shown with the cyan dotted line. Bottom: gradient function of the very extended surface brightness profile shown above; in this case, the flattest region of the gradient function was taken from 170 to 190 arcsec. UGC 01839 has an irregular background. However, there is a flat region between ∼170 and ∼190 arcsec that we use to obtain the mean sky value. Note that the sky had been oversubtracted in the original image.
Current usage metrics show cumulative count of Article Views (full-text article views including HTML views, PDF and ePub downloads, according to the available data) and Abstracts Views on Vision4Press platform.
Data correspond to usage on the plateform after 2015. The current usage metrics is available 48-96 hours after online publication and is updated daily on week days.
Initial download of the metrics may take a while.