Fig. A.3.
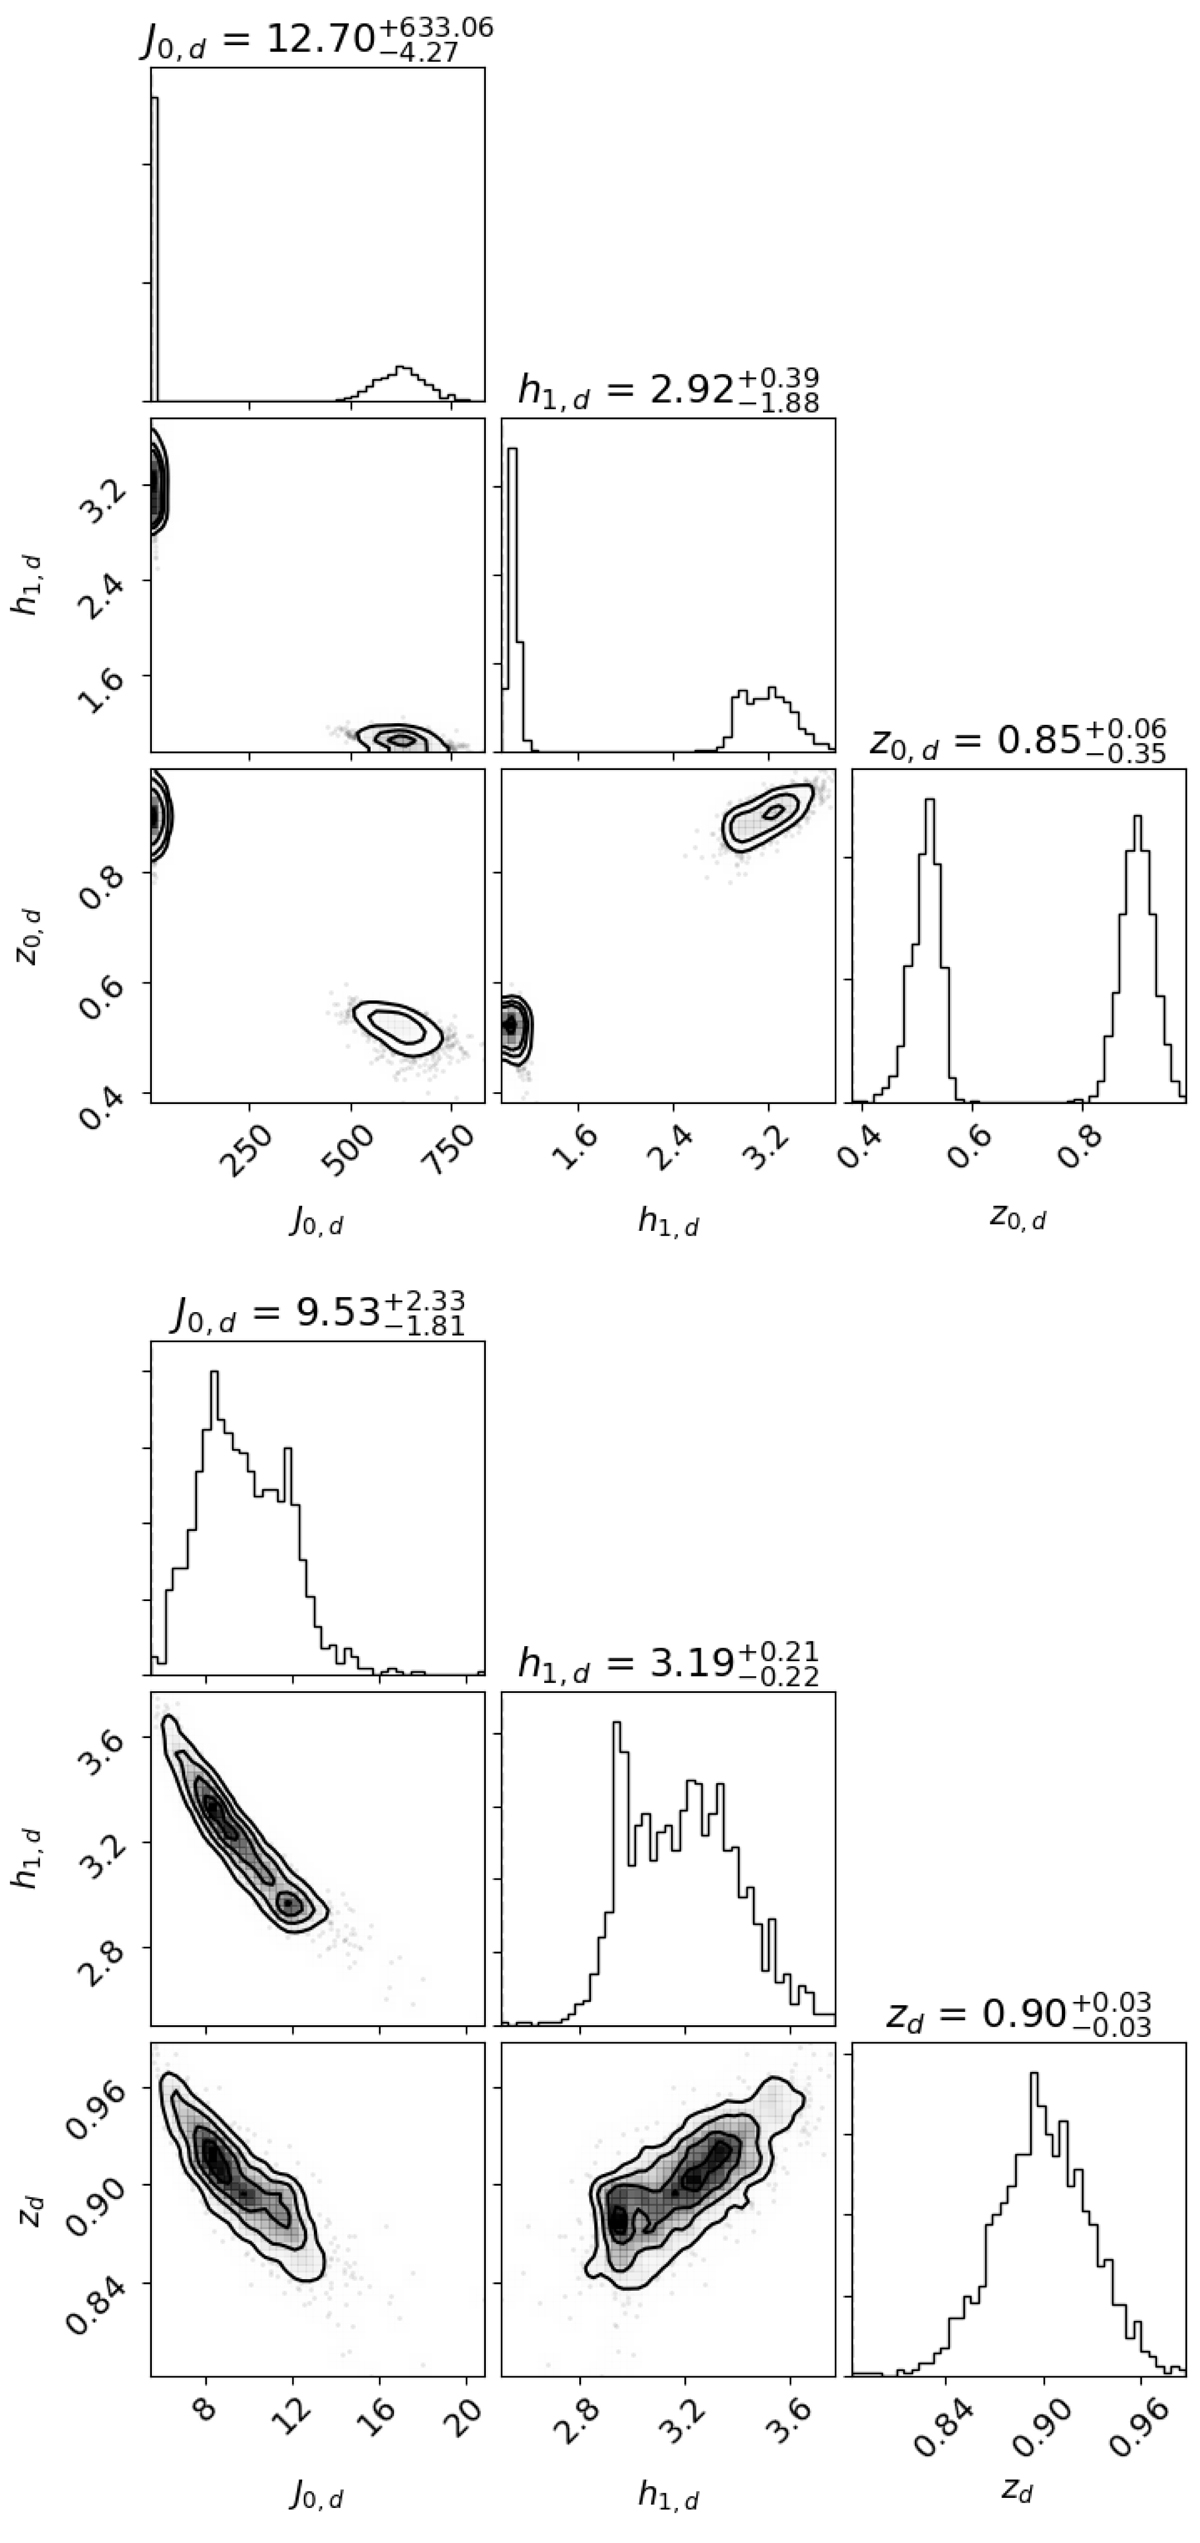
Same as Fig. A.1, now for the edge-on galaxy UGC 00931. However, in this galaxy we had a particular situation: we obtained two possible solutions for the fit that are shown in the two panels (upper panel 2500 iterations, lower panel 1500 iterations). We chose the set of parameters that was most likely and had greater physical sense, regarding the physical parameters values and the surface brightness profiles shape. Thus, we selected the option of the bottom panel. In the upper left panel of the top panel and in the corresponding profile generated by this model (Fig. A.4), we see that the main reasons for discrepancy between both models are in the central intensity of the disc (J0, d) as ![]() values pix−1, and in the light distribution (shown in profile of Fig. A.4). Thus, the set of chosen values is
values pix−1, and in the light distribution (shown in profile of Fig. A.4). Thus, the set of chosen values is ![]() values pix−1,
values pix−1, ![]() kpc, and
kpc, and ![]() kpc (lower panel).
kpc (lower panel).
Current usage metrics show cumulative count of Article Views (full-text article views including HTML views, PDF and ePub downloads, according to the available data) and Abstracts Views on Vision4Press platform.
Data correspond to usage on the plateform after 2015. The current usage metrics is available 48-96 hours after online publication and is updated daily on week days.
Initial download of the metrics may take a while.