Fig. 7
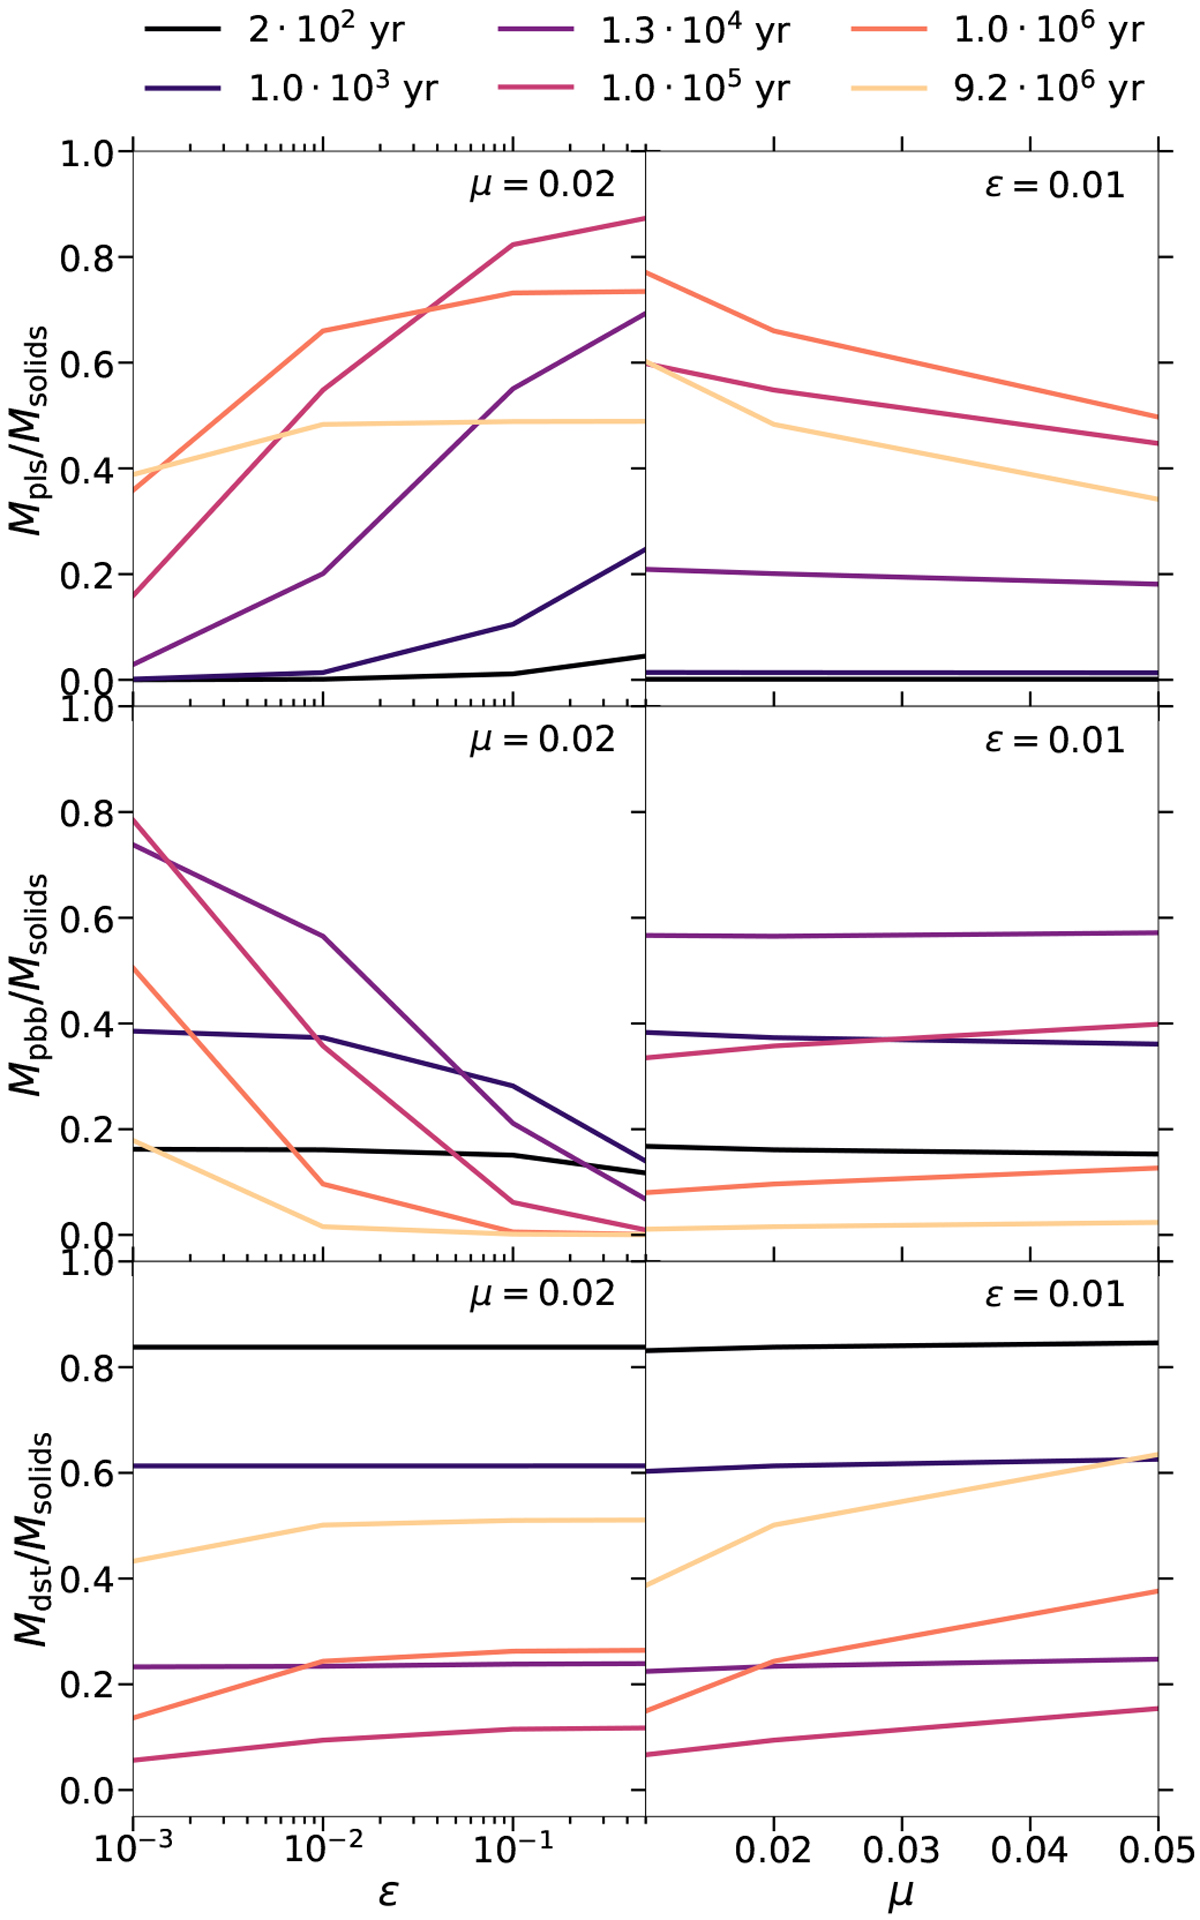
Mass fraction in planetesimals (top panels), pebbles (middle panels) and dust (bottom panels) vs. trap efficiency ɛ (left panels) and disk mass μ = Mdisk∕M⊙ (right panels). Left panels: the disk mass is fixed at μ = 0.02 while the trap efficiency is fixed to ɛ = 0.01 in the right panels. Colors correspond to different times in the disk evolution. Data is taken from the same simulation runs that were depicted in Fig. 6. However, Fig. 7 does not differentiate between primordial and collisional populations and depicts their sum.
Current usage metrics show cumulative count of Article Views (full-text article views including HTML views, PDF and ePub downloads, according to the available data) and Abstracts Views on Vision4Press platform.
Data correspond to usage on the plateform after 2015. The current usage metrics is available 48-96 hours after online publication and is updated daily on week days.
Initial download of the metrics may take a while.