Fig. 6
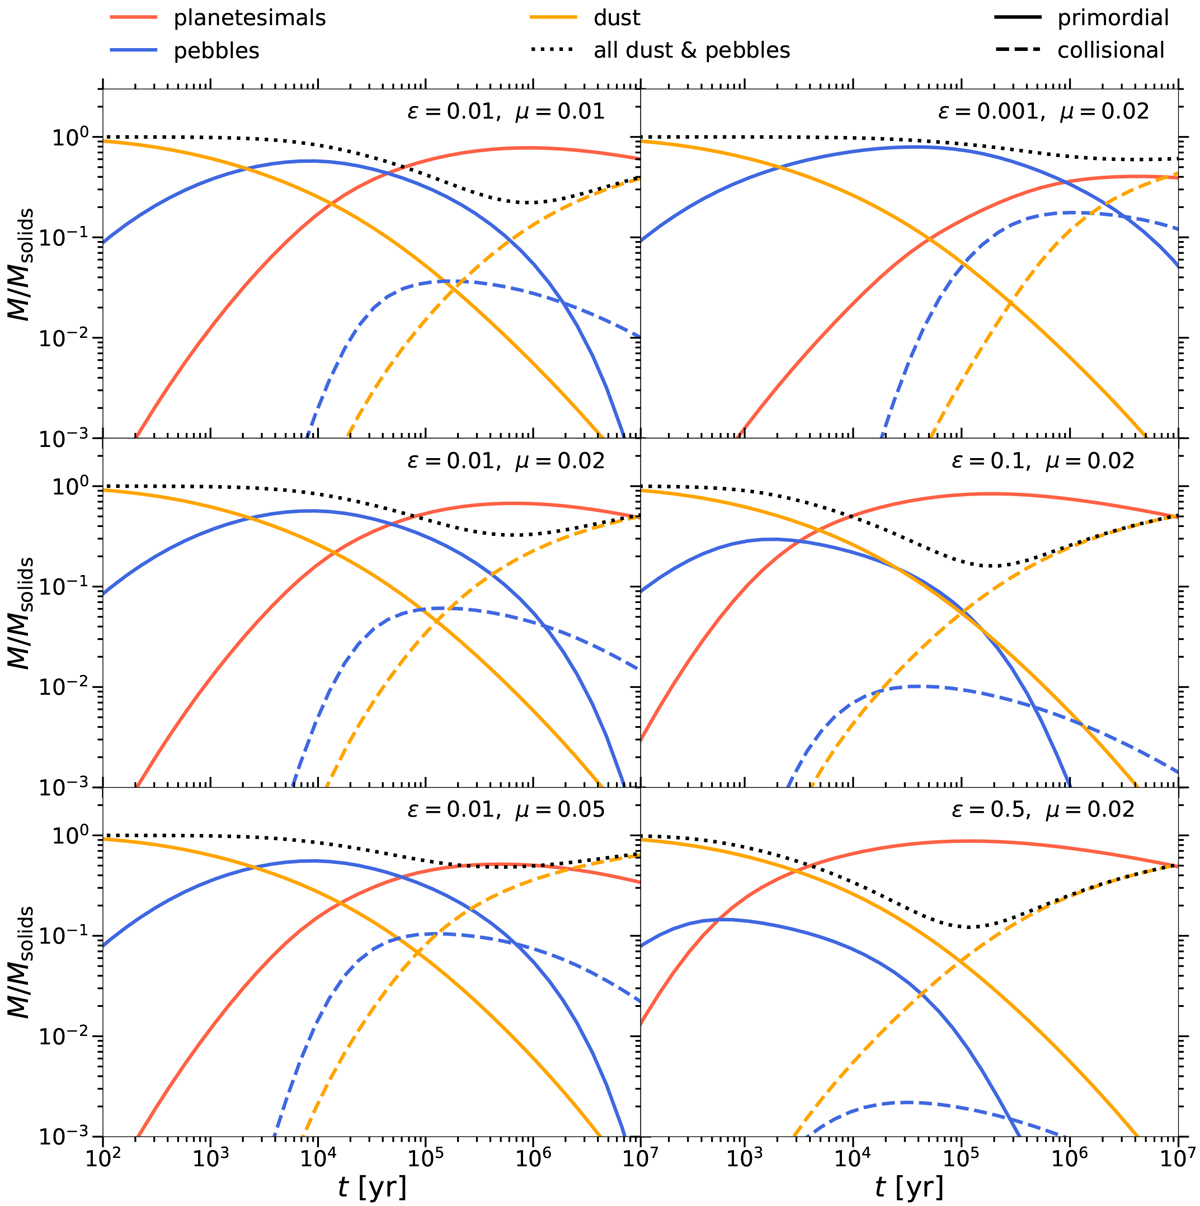
Evolution of the normalized total mass of solid particles in the disk for different values of ɛ ∈ {0.001, 0.01, 0.1, 0.5} and disk mass μ = Mdisk∕M⊙∈{0.01, 0.02, 0.05}. Different colors correspond to the different species (red: planetesimals, yellow: dust, blue: pebbles, black dotted lines: dust and pebbles combined), the solid lines to primordial and the dashed lines to collisional populations. Left panels: disk mass increases from top to bottom while the trap efficiency ɛ remains constant. Likewise, in the right panels: trap efficiency increases downward, however the middle left panel would also fit within this sequence between the top right and the middle right panel.
Current usage metrics show cumulative count of Article Views (full-text article views including HTML views, PDF and ePub downloads, according to the available data) and Abstracts Views on Vision4Press platform.
Data correspond to usage on the plateform after 2015. The current usage metrics is available 48-96 hours after online publication and is updated daily on week days.
Initial download of the metrics may take a while.