Fig. 4
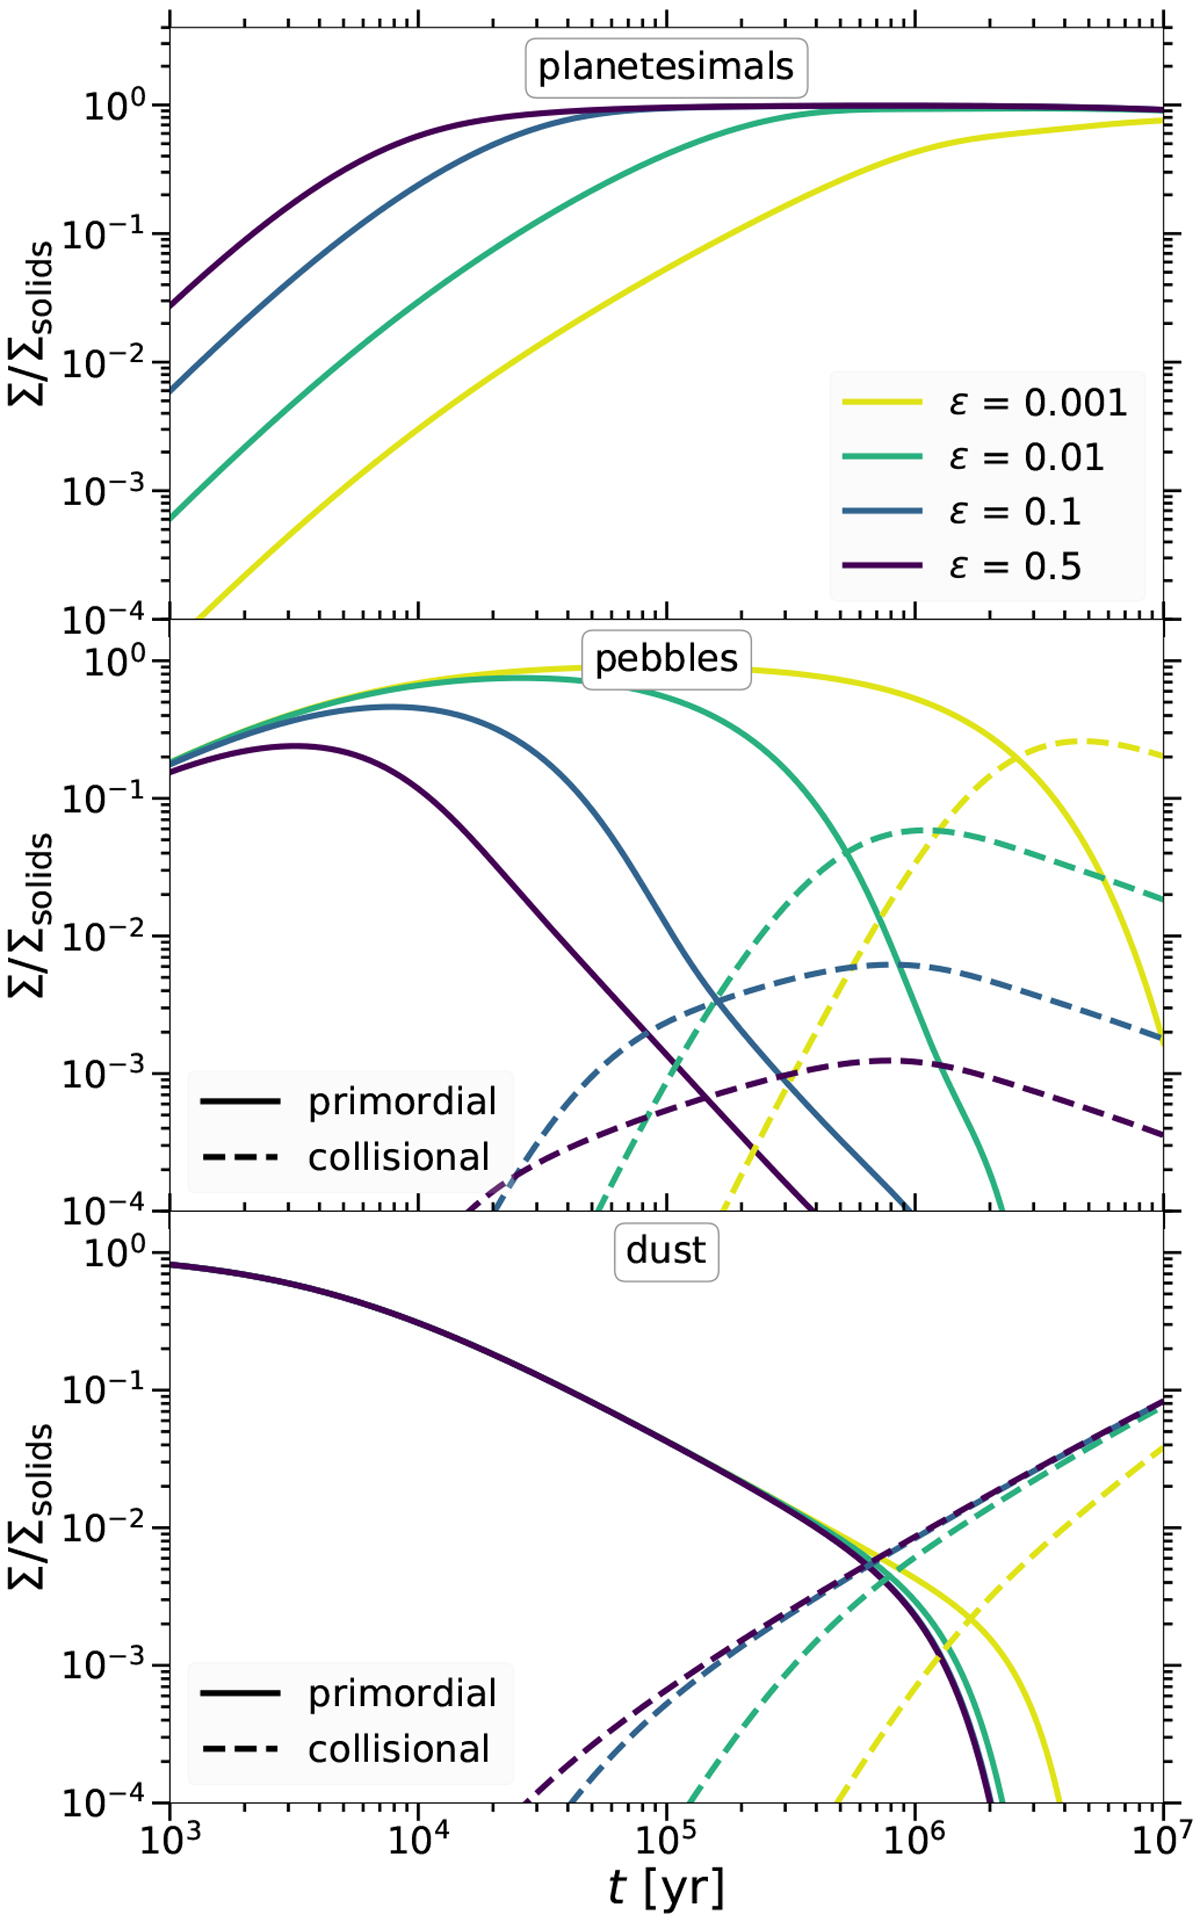
Local evolution at R = 10 AU for Mdisk = 0.01M⊙ of the normalized column density for different values of the trap efficiency parameter ɛ (indicated by different colors). Top panel: evolution of the planetesimal column density. Middle panel: both primordial (solid lines) and collisional pebble populations (dashed lines). Bottom panel: primordial dust (solid lines) and its collisional counterpart (dashed lines).
Current usage metrics show cumulative count of Article Views (full-text article views including HTML views, PDF and ePub downloads, according to the available data) and Abstracts Views on Vision4Press platform.
Data correspond to usage on the plateform after 2015. The current usage metrics is available 48-96 hours after online publication and is updated daily on week days.
Initial download of the metrics may take a while.