Fig. 3
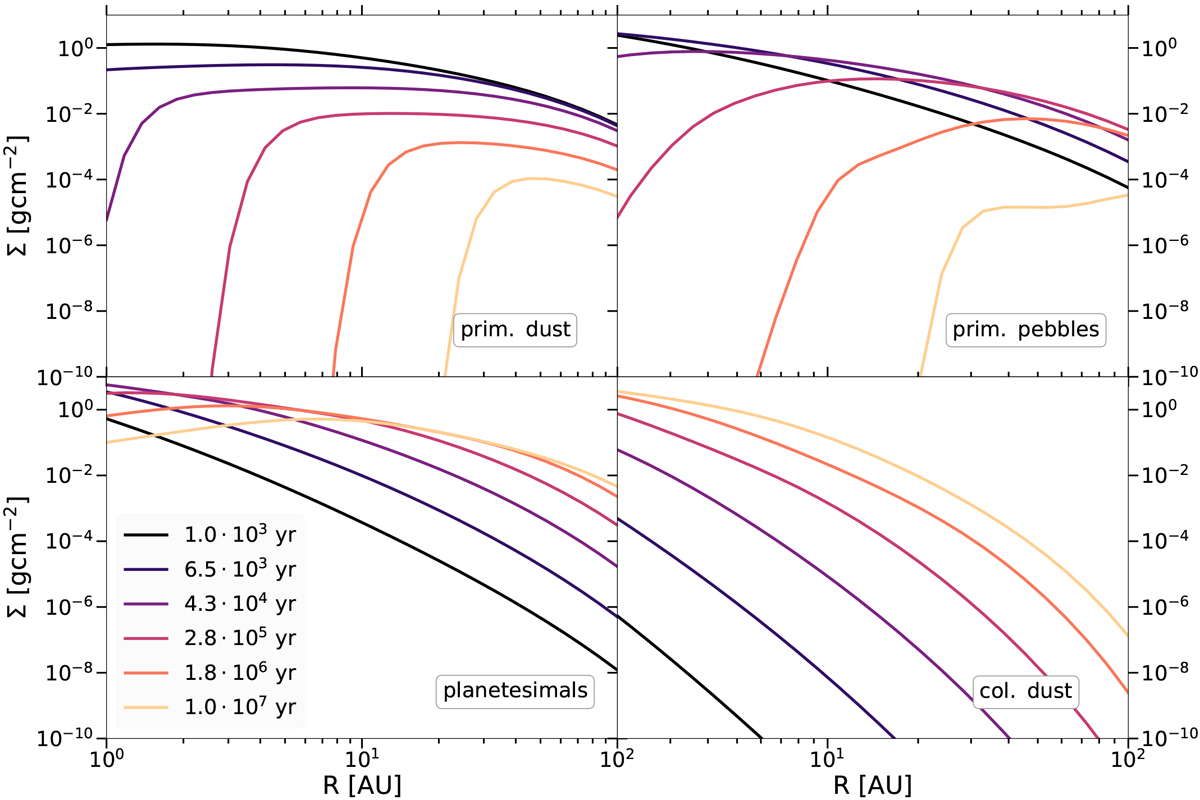
Column density of different populations is displayed against R for several snapshots. Top left panel: primordial dust, top right, bottom left and bottom right: primordial pebbles, planetesimals and collisional dust, respectively. We depict a combined result of multiple 0-d simulations executed at 20 different radii to allow an insight in a possible global evolution of the dust profile. All simulations shown in this figure used ɛ = 0.01.
Current usage metrics show cumulative count of Article Views (full-text article views including HTML views, PDF and ePub downloads, according to the available data) and Abstracts Views on Vision4Press platform.
Data correspond to usage on the plateform after 2015. The current usage metrics is available 48-96 hours after online publication and is updated daily on week days.
Initial download of the metrics may take a while.