Fig. 9.
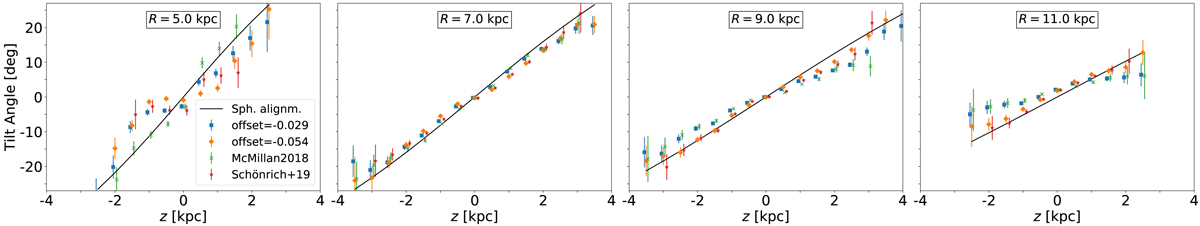
Tilt angles as a function of Galactic height for different positions across the Galaxy. We show the trends with z for R = [5, 7, 9, 11] kpc for different distance estimates for the stars. The blue squares and orange diamonds use distances based on inverting the parallaxes after correcting the parallaxes for an offset of −29 μas and −54 μas, respectively. The green crosses and red starred symbols use Bayesian distances from McMillan (2018) and Schönrich et al. (2019), respectively. The solid black line shows the trend that would correspond to spherical alignment.
Current usage metrics show cumulative count of Article Views (full-text article views including HTML views, PDF and ePub downloads, according to the available data) and Abstracts Views on Vision4Press platform.
Data correspond to usage on the plateform after 2015. The current usage metrics is available 48-96 hours after online publication and is updated daily on week days.
Initial download of the metrics may take a while.