Fig. 7.
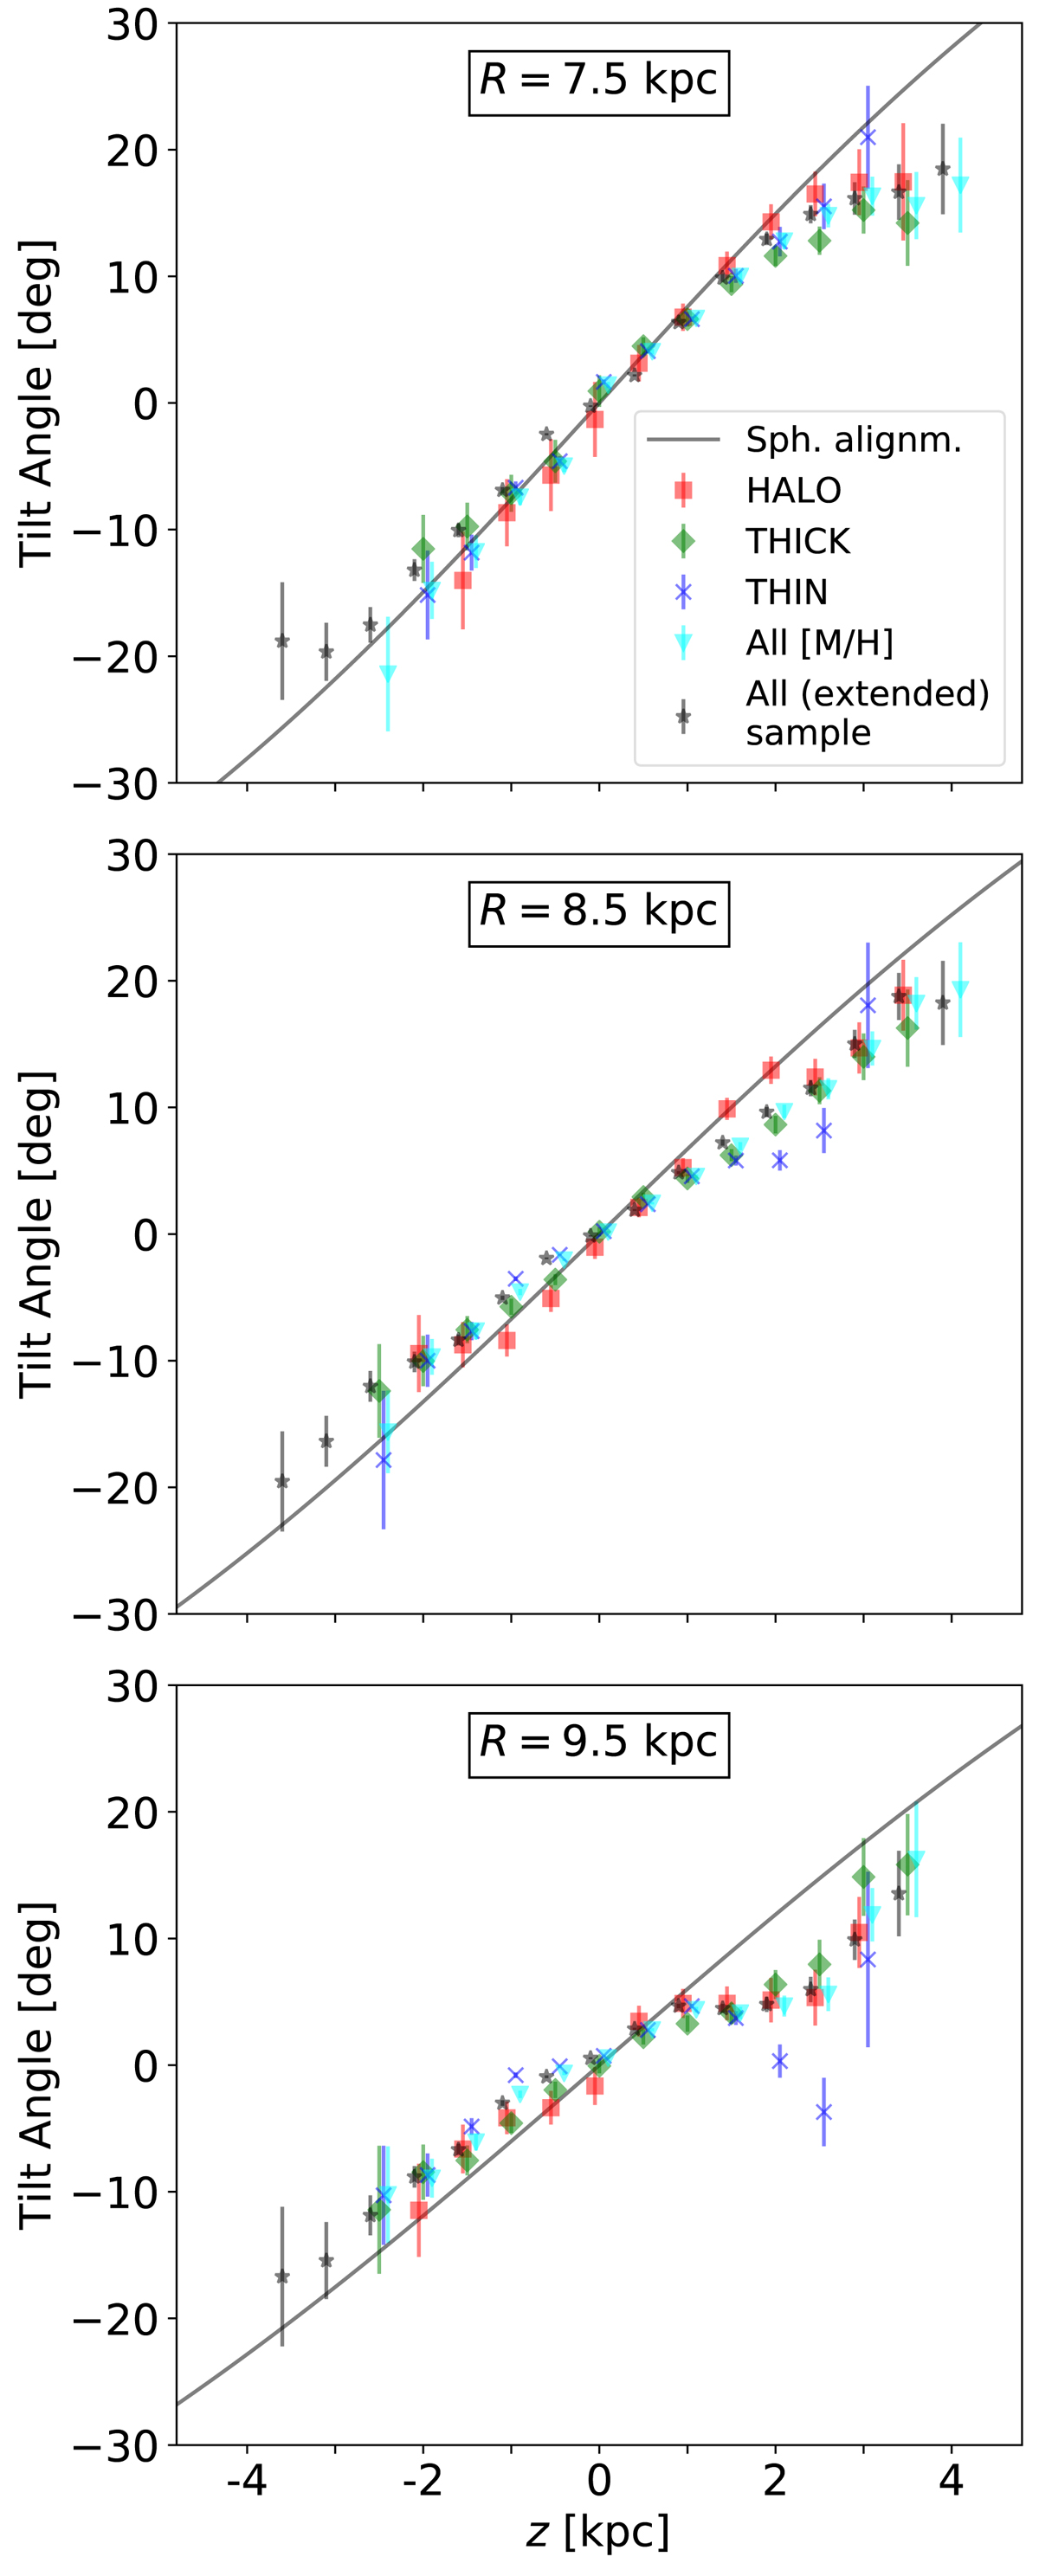
Tilt angles as a function of Galactic height for different populations of stars. We show the trends with z for R = 7.5 kpc (top), R = 8.5 kpc (middle) and R = 9.5 kpc (bottom). The red squares, green diamonds, and blue crosses show the results for the halo, thick, and thin disk population described in Sect. 4.3, respectively. The light blue triangles correspond to all LAMOST stars with metallicity information with uncertainties smaller than 0.2 dex, while the black stars are for all stars in the extended sample regardless of whether or not they have metallicity information. The solid black line shows the trend that would correspond to spherical alignment.
Current usage metrics show cumulative count of Article Views (full-text article views including HTML views, PDF and ePub downloads, according to the available data) and Abstracts Views on Vision4Press platform.
Data correspond to usage on the plateform after 2015. The current usage metrics is available 48-96 hours after online publication and is updated daily on week days.
Initial download of the metrics may take a while.