Fig. 3.
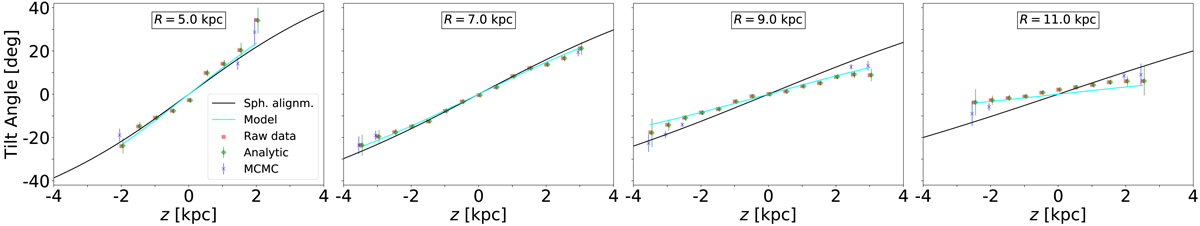
Tilt angles as a function of Galactic height for different positions across the Galaxy. We show the trends with z for R = [5, 7, 9, 11] kpc. The red squares, green diamonds, and blue crosses are based on the methods described in Sect. 3.2 (see text). The solid black line shows the trend that would correspond to spherical alignment. The tilt angle is changing from spherical alignment in the inner Galaxy (R ∼ 5 kpc) towards shallower tilt angles at R ∼ 11 kpc. The cyan line shows the analytic description of the data as proposed in Sect. 4.4.
Current usage metrics show cumulative count of Article Views (full-text article views including HTML views, PDF and ePub downloads, according to the available data) and Abstracts Views on Vision4Press platform.
Data correspond to usage on the plateform after 2015. The current usage metrics is available 48-96 hours after online publication and is updated daily on week days.
Initial download of the metrics may take a while.