Fig. 2.
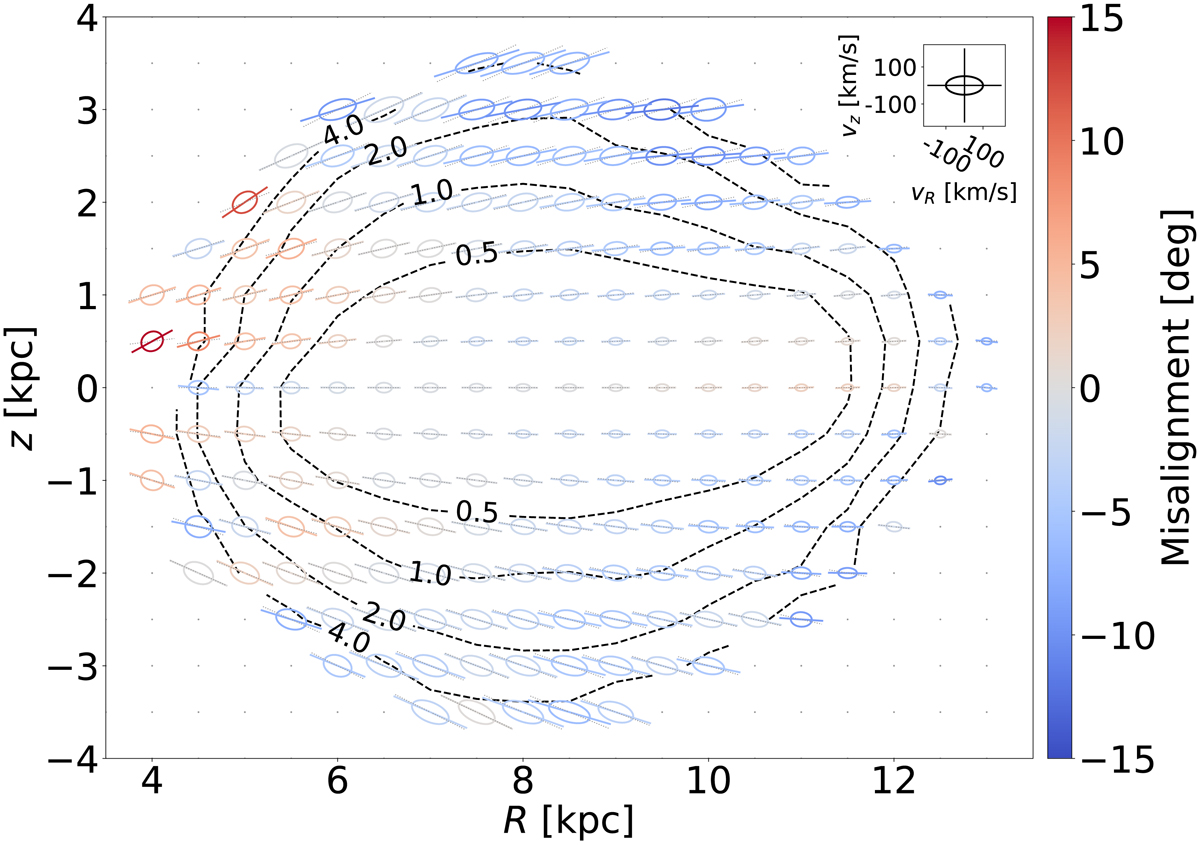
Velocity ellipses in the meridional plane. The ellipses are colour-coded by their misalignment with respect to spherical alignment. The orientation that corresponds to spherical alignment is indicated by the dotted grey line through each ellipse. The inset in the top right of the figure shows the velocity ellipse for a non-tilted distribution with dispersions σ(vR)=100 km s−1 and σ(vz)=50 km s−1 (see Sect. 4 for more information). The contours show the (relatively small) formal statistical errors on the recovered tilt angles and are drawn for error levels of [0.5, 1.0, 2.0, 4.0] degrees. See Sect. 5 for a discussion on the effect of systematic errors.
Current usage metrics show cumulative count of Article Views (full-text article views including HTML views, PDF and ePub downloads, according to the available data) and Abstracts Views on Vision4Press platform.
Data correspond to usage on the plateform after 2015. The current usage metrics is available 48-96 hours after online publication and is updated daily on week days.
Initial download of the metrics may take a while.