Fig. 8.
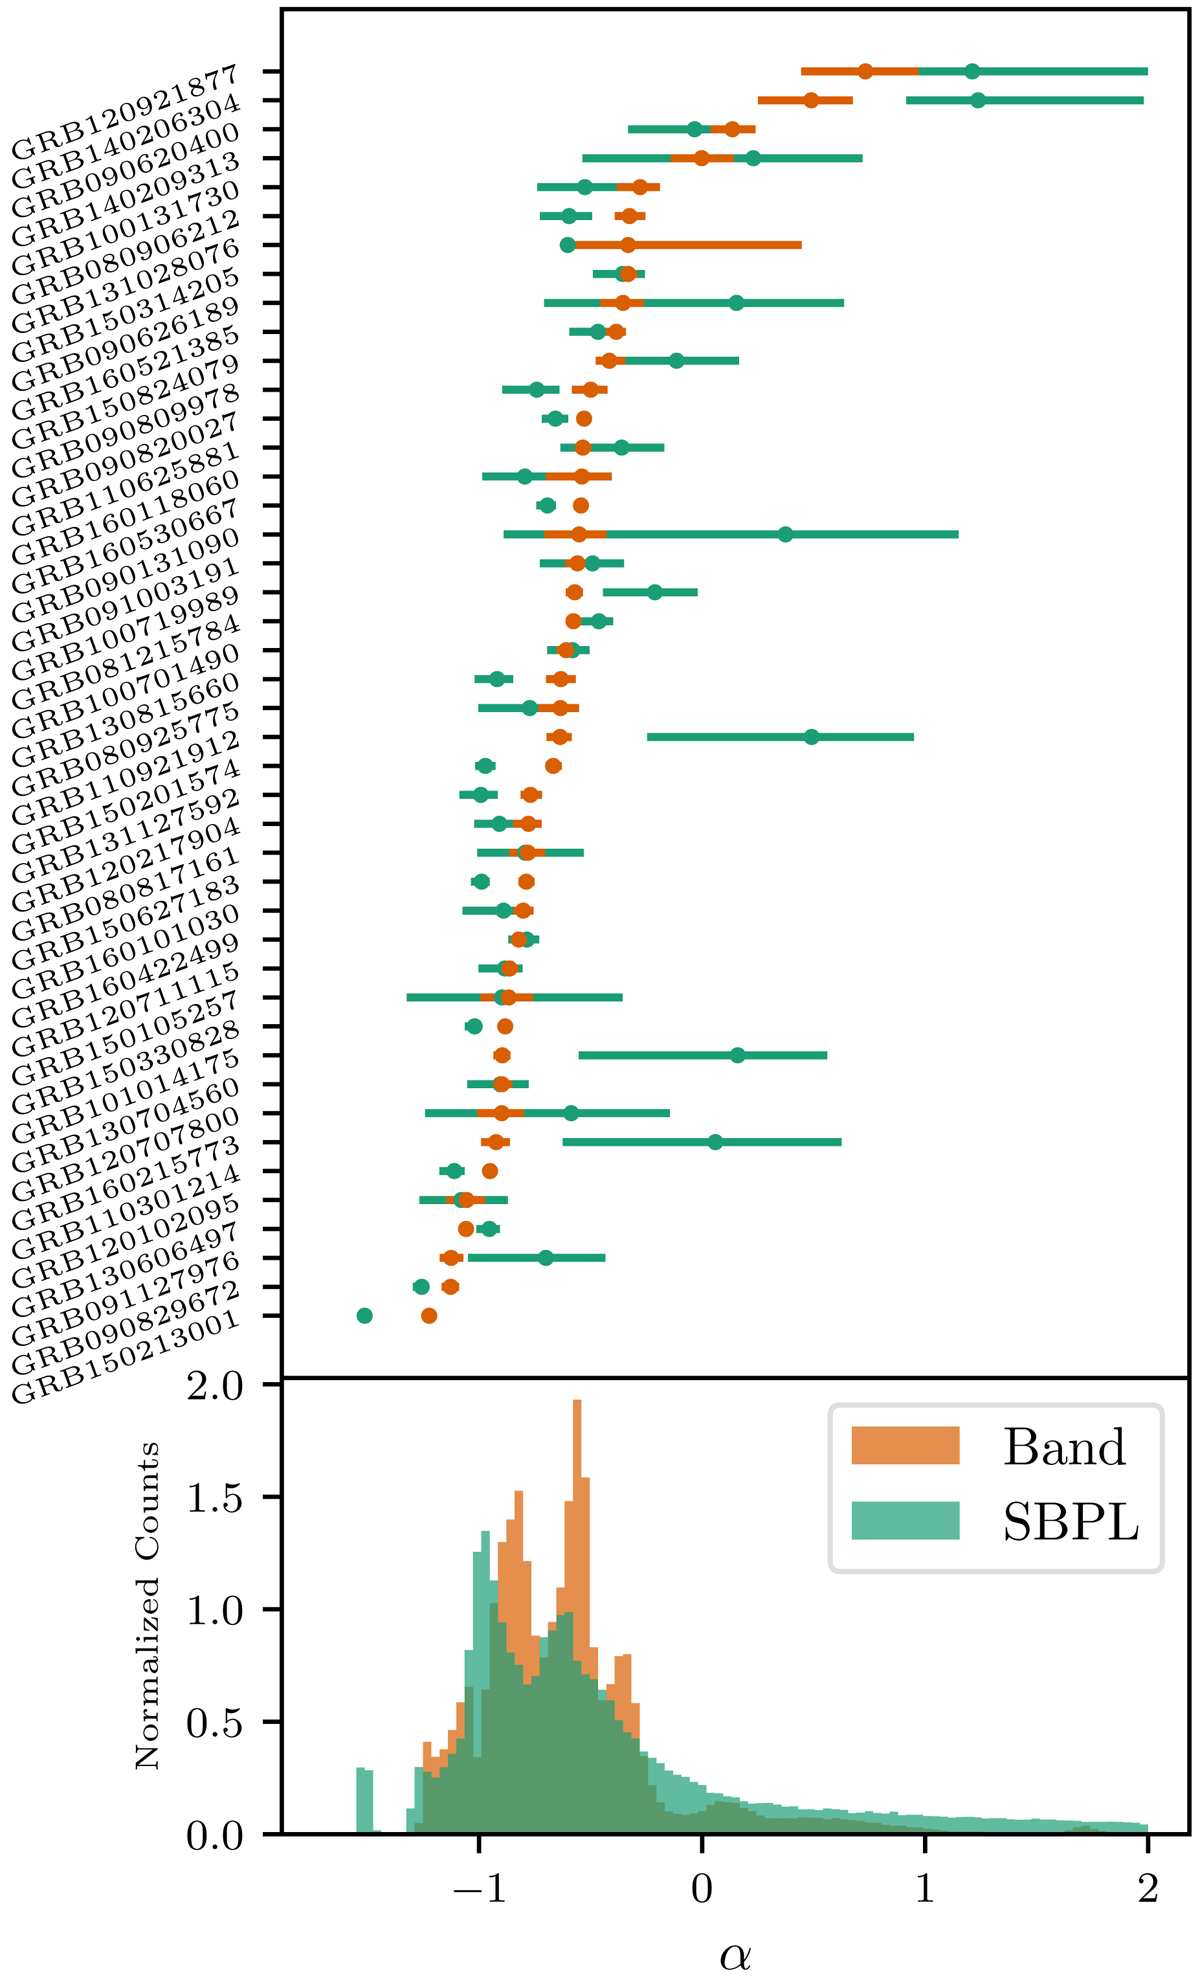
Distributions of the low-energy index (α) from the Band and SBPL fits. The error bars represent the 0.68 highest posterior density intervals. There are systematic differences between the values of α due to the free curvature of the SBPL. The lower histograms are produced from the combined marginal distributions of the fits to fully incorporate the uncertainty in the fits.
Current usage metrics show cumulative count of Article Views (full-text article views including HTML views, PDF and ePub downloads, according to the available data) and Abstracts Views on Vision4Press platform.
Data correspond to usage on the plateform after 2015. The current usage metrics is available 48-96 hours after online publication and is updated daily on week days.
Initial download of the metrics may take a while.