Open Access
Fig. 7.
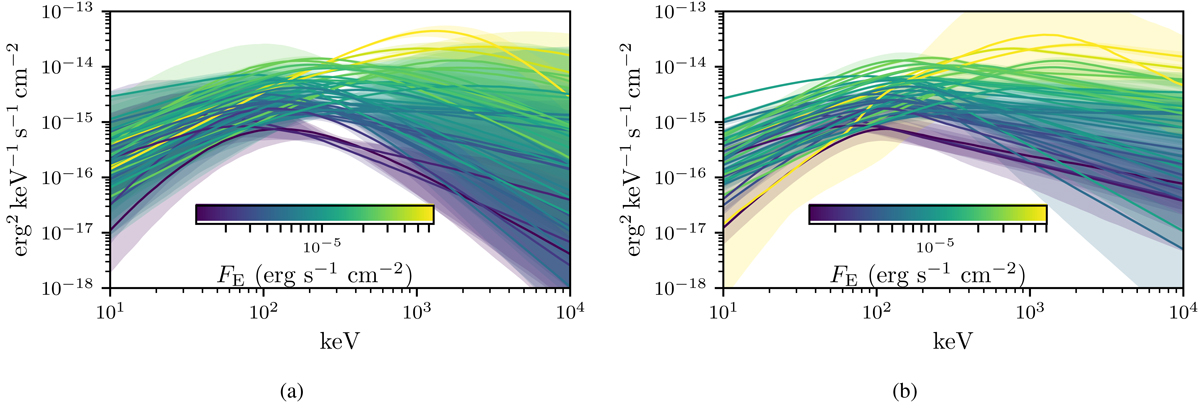
νFν spectra and 1σ contours of the SBPL (left) and Band (right) fits. The color corresponds to the 10 keV–4 MeV integrated energy flux (FE). The SBPL fits result in broader or smoother curvature around the νFν peak.
Current usage metrics show cumulative count of Article Views (full-text article views including HTML views, PDF and ePub downloads, according to the available data) and Abstracts Views on Vision4Press platform.
Data correspond to usage on the plateform after 2015. The current usage metrics is available 48-96 hours after online publication and is updated daily on week days.
Initial download of the metrics may take a while.