Fig. 3.
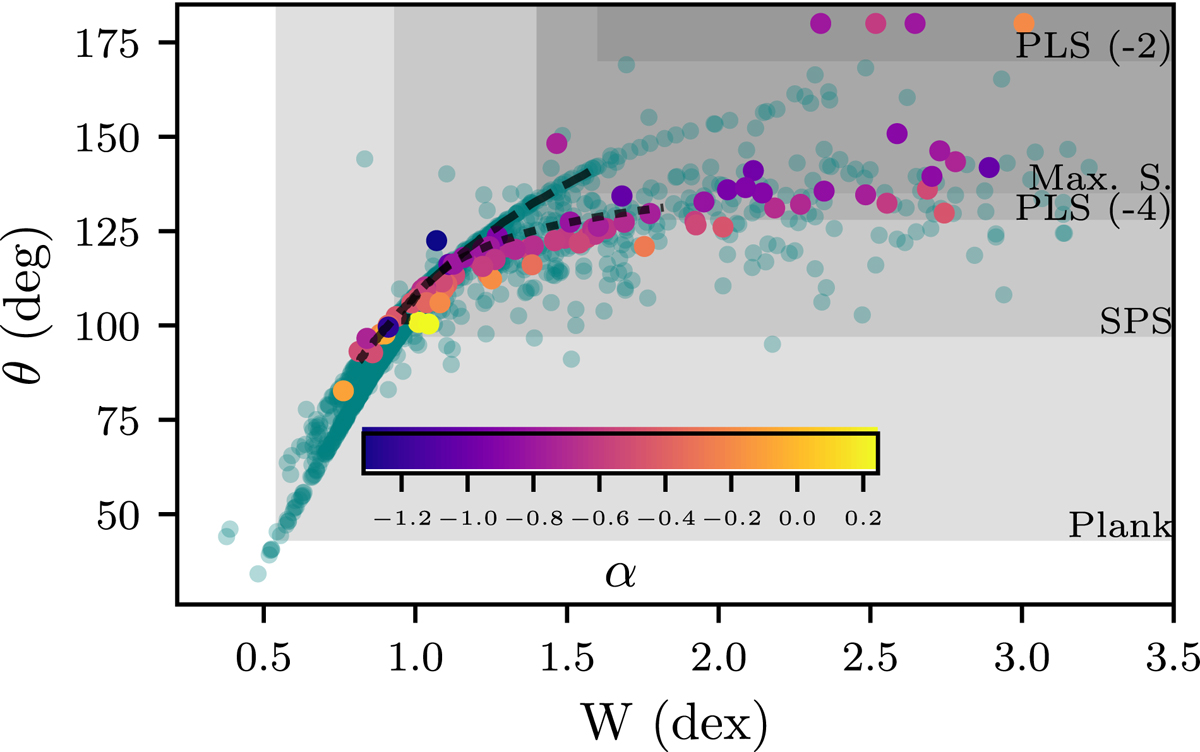
W − θ plane from the full GBM catalog (teal) and the subsample of GRBs best fit by the Band function or a SBPL (purple-yellow). The boxes are the allowed regions for the corresponding physical emission mechanisms. The color of the subsample corresponds to the low-energy index (α) of the spectral fit. The two black dashed lines demonstrate how the W − θ plain evolves for fixed β (big dashes) and fixed α (small dashes).
Current usage metrics show cumulative count of Article Views (full-text article views including HTML views, PDF and ePub downloads, according to the available data) and Abstracts Views on Vision4Press platform.
Data correspond to usage on the plateform after 2015. The current usage metrics is available 48-96 hours after online publication and is updated daily on week days.
Initial download of the metrics may take a while.