Open Access
Fig. 2.
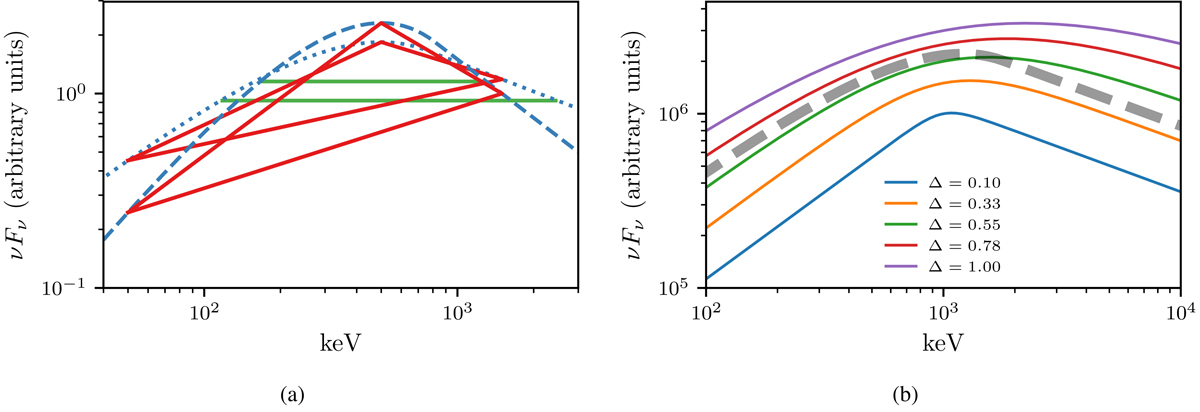
Left: illustration of how W (green lines) and θ (via the red triangles) are realized on two different toy Band functions. Right: example of how the SBPL varies with Δ. For comparison, a Band function is superimposed in black dashed lines.
Current usage metrics show cumulative count of Article Views (full-text article views including HTML views, PDF and ePub downloads, according to the available data) and Abstracts Views on Vision4Press platform.
Data correspond to usage on the plateform after 2015. The current usage metrics is available 48-96 hours after online publication and is updated daily on week days.
Initial download of the metrics may take a while.