Fig. 10.
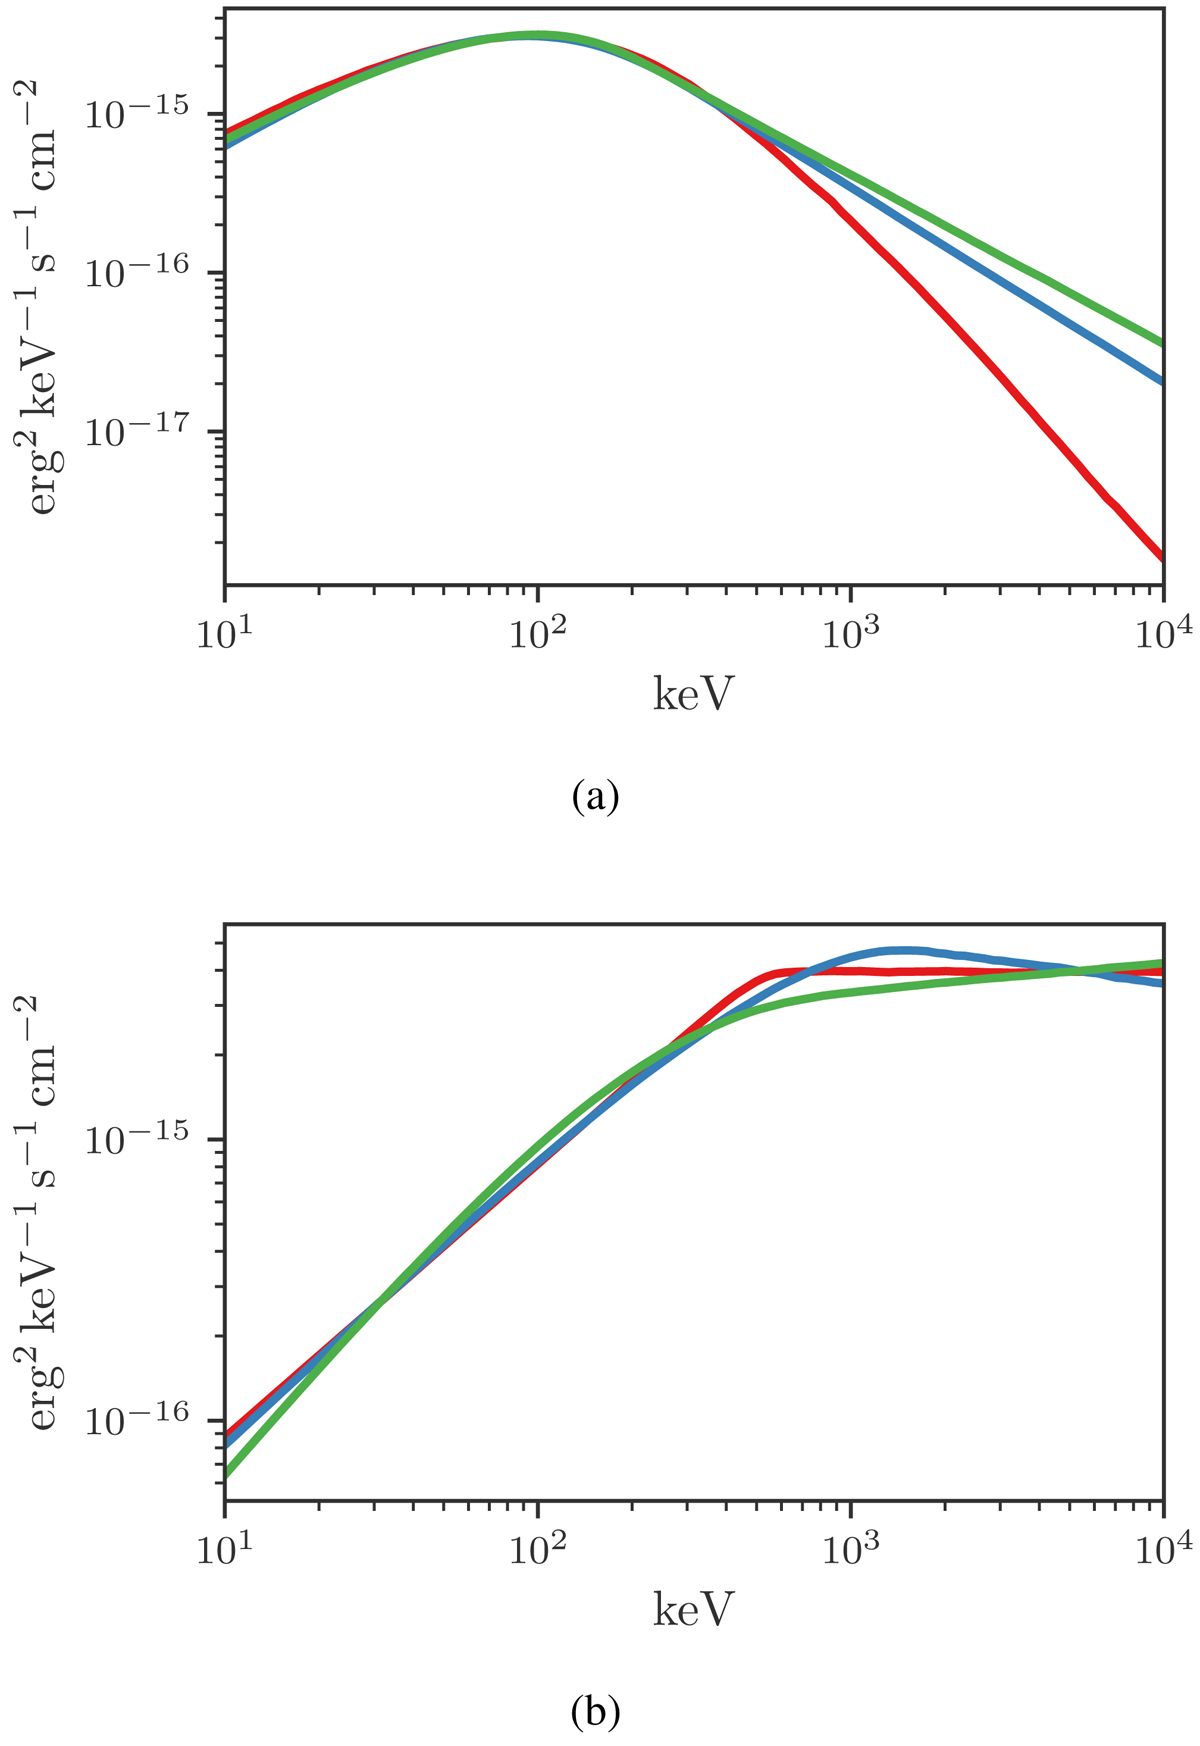
Two examples of how the SBPL (blue) and Band (red) function fit a synthetic synchrotron spectrum (green). Top: an example where the SBPL models the synchrotron (W = −1.4, θ = 128) emission adequately while the Band function is too narrow and artificially softens β to compensate. Bottom: both the SBPL and Band functions are poor approximations of the true synchrotron spectrum (W = −1.6, θ = 170) and hence would result in poor empirical inference about the true underlying mechanism.
Current usage metrics show cumulative count of Article Views (full-text article views including HTML views, PDF and ePub downloads, according to the available data) and Abstracts Views on Vision4Press platform.
Data correspond to usage on the plateform after 2015. The current usage metrics is available 48-96 hours after online publication and is updated daily on week days.
Initial download of the metrics may take a while.