Fig. 3.
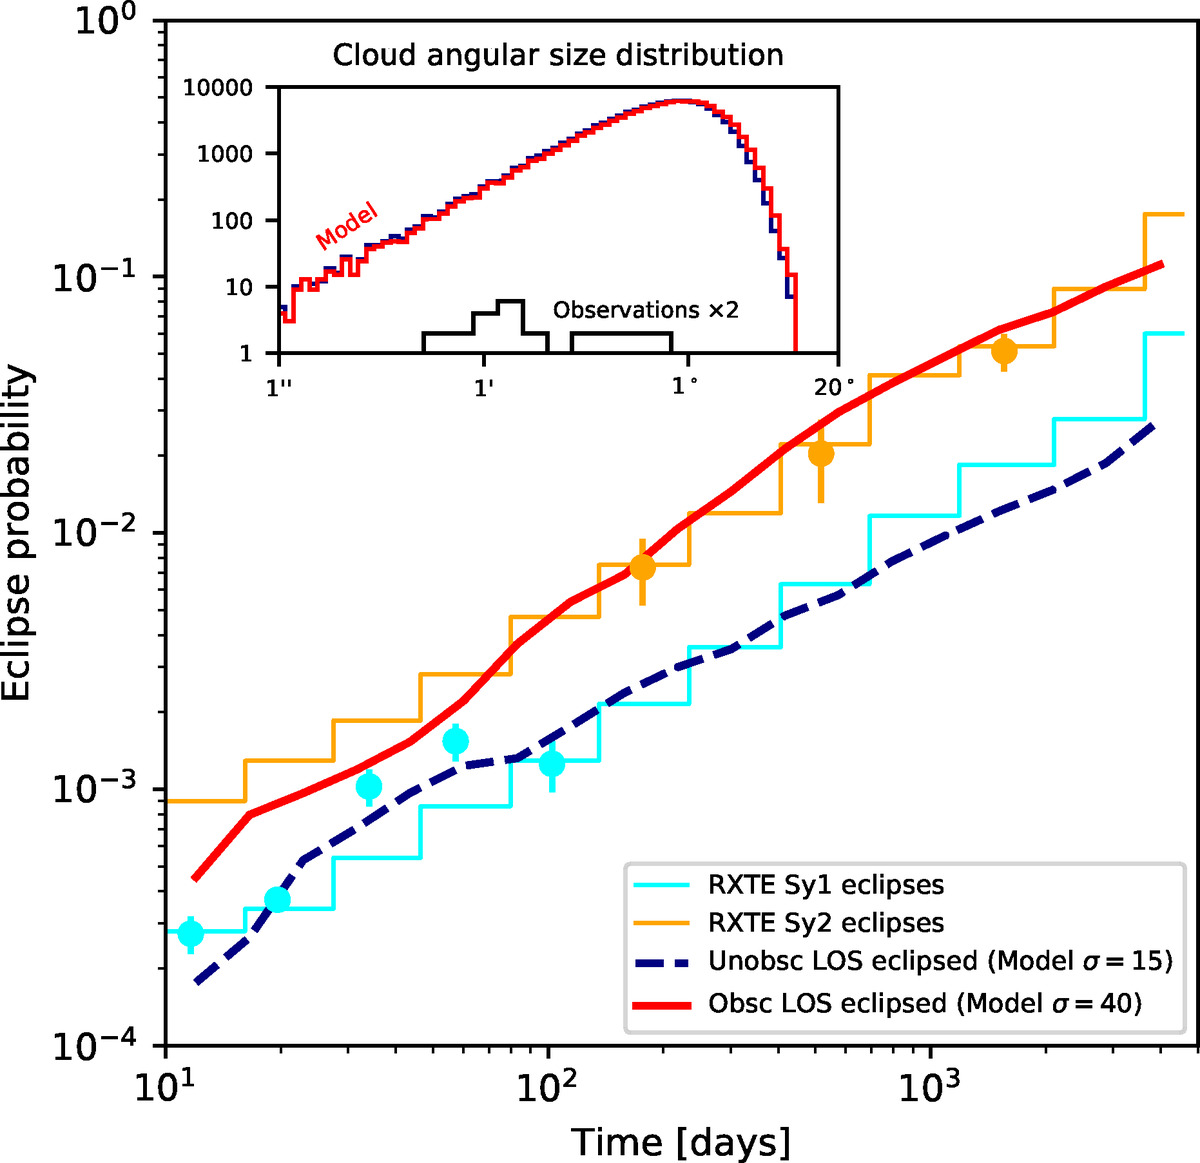
Predicted rates of eclipses by our model. The probability for an eclipse in a sightline after a given delay is computed, with model clouds on random, circular Keplerian orbits. The systematic study of eclipse event rates measured with the RXTE satellite by Markowitz et al. (2014) are drawn with orange/cyan error bars (type-1/type-2, respectively), with steps approximating their observation window function. We analyse two cases: How frequently an obscured sightline becomes more obscured (red curve) in a high-covering geometry, and how frequently an unobscured sightline becomes obscured in a low-covering geometry (dashed blue curve). The eclipse probability increases with the covering factor. The angular diameter distribution of the model clouds is shown in the inset (blue: low-covering model, red: high-covering model). Sizes of individual observed eclipsing clouds are shown as a black histogram (Nikutta et al., in prep.), covering the low-end tail of the intrinsic distribution.
Current usage metrics show cumulative count of Article Views (full-text article views including HTML views, PDF and ePub downloads, according to the available data) and Abstracts Views on Vision4Press platform.
Data correspond to usage on the plateform after 2015. The current usage metrics is available 48-96 hours after online publication and is updated daily on week days.
Initial download of the metrics may take a while.