Fig. 2.
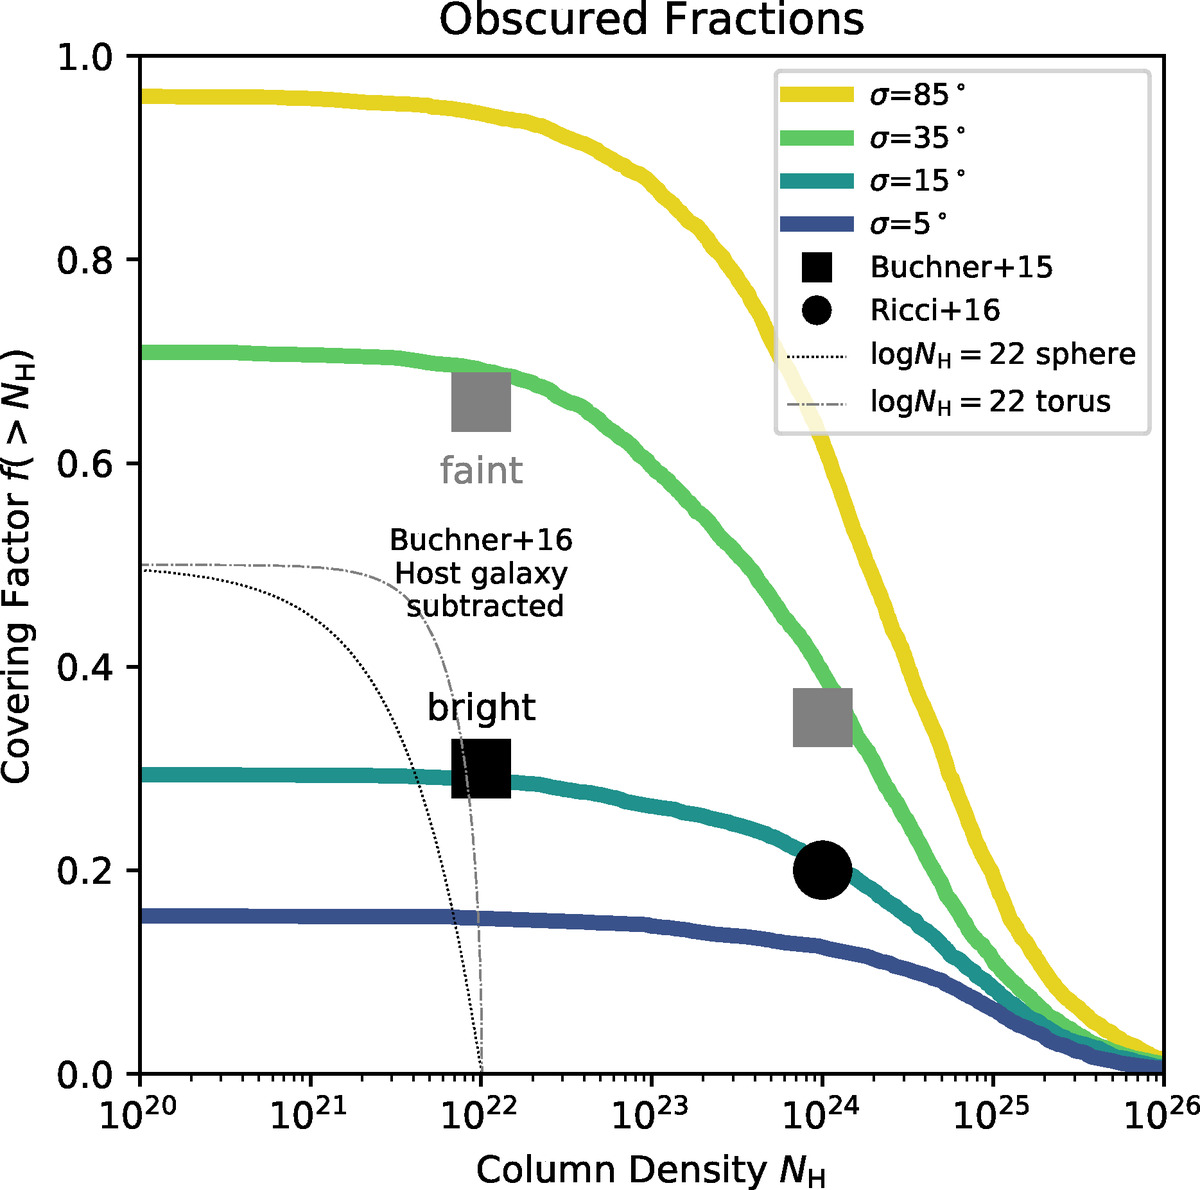
Column density distribution and associated covering fractions produced by our clumpy model. The curves represent variations of the angular width parameter σ. Obscured fractions from AGN surveys are shown as black and grey symbols, for bright and faint AGN, respectively. Varying σ allows a single instance of our model to reproduce the column density distributions of the population at various luminosities. Thin grey curves show the comparatively narrow column density distributions of a single sphere and a torus, each with a maximum crossing column density of NH = 1022 cm−2.
Current usage metrics show cumulative count of Article Views (full-text article views including HTML views, PDF and ePub downloads, according to the available data) and Abstracts Views on Vision4Press platform.
Data correspond to usage on the plateform after 2015. The current usage metrics is available 48-96 hours after online publication and is updated daily on week days.
Initial download of the metrics may take a while.