Fig. 8.
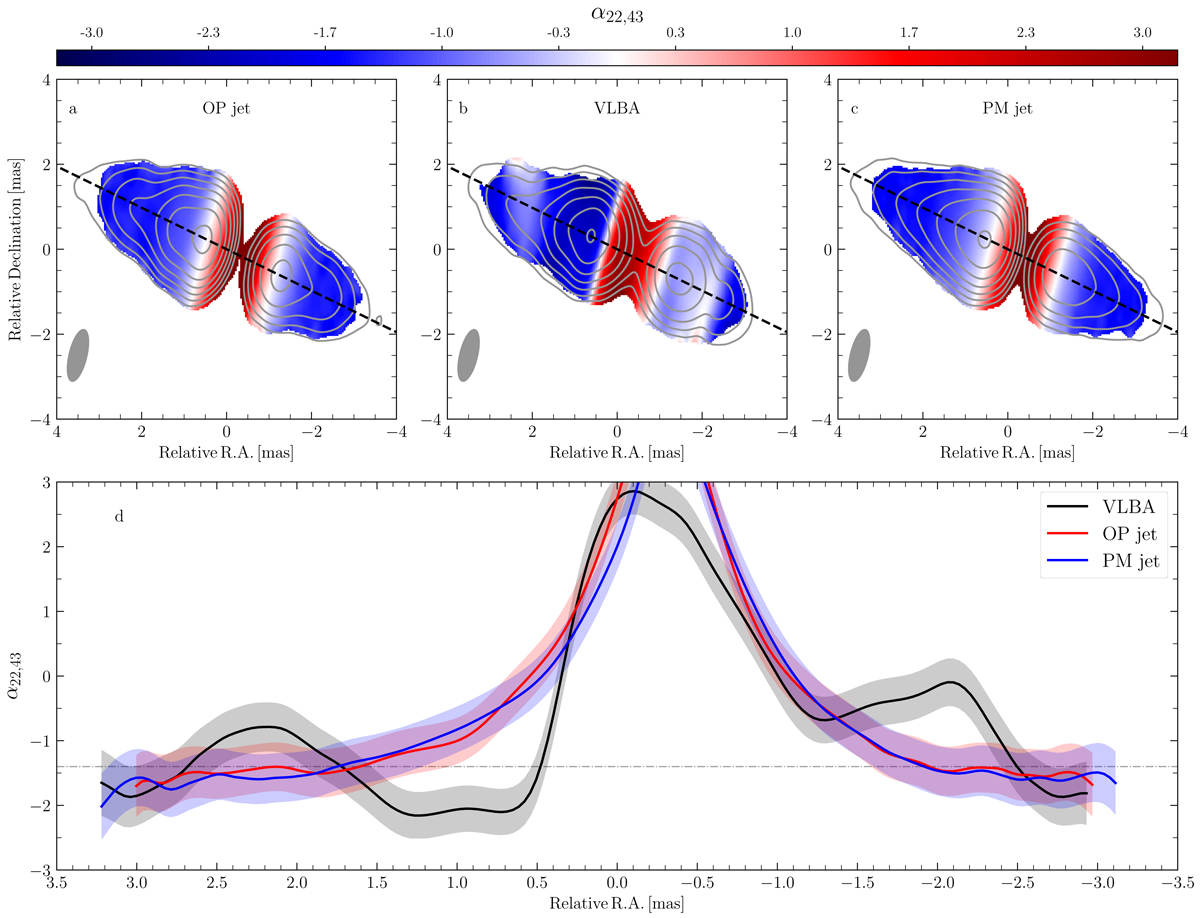
Spectral index maps for NGC 1052. Panel a: 2D-distribution of the spectral index for the OP jet model, panel b: VLBA observations of NGC 1052 and panel c: PM jet model. The variation of the spectral index along the jet axis (black dashed line in panels a–c) can be seen in panel d. In panels a–c, the convolving beam is plotted in the lower left corner of each panel. The contours correspond to the 22 GHz flux density distribution and the lowest flux density contour is drawn at 1 mJy and increases by factors of two. The dash-dotted line in panel d corresponds to the optically thin spectral index of the models (α = 1.4).
Current usage metrics show cumulative count of Article Views (full-text article views including HTML views, PDF and ePub downloads, according to the available data) and Abstracts Views on Vision4Press platform.
Data correspond to usage on the plateform after 2015. The current usage metrics is available 48-96 hours after online publication and is updated daily on week days.
Initial download of the metrics may take a while.