Free Access
Fig. 7.
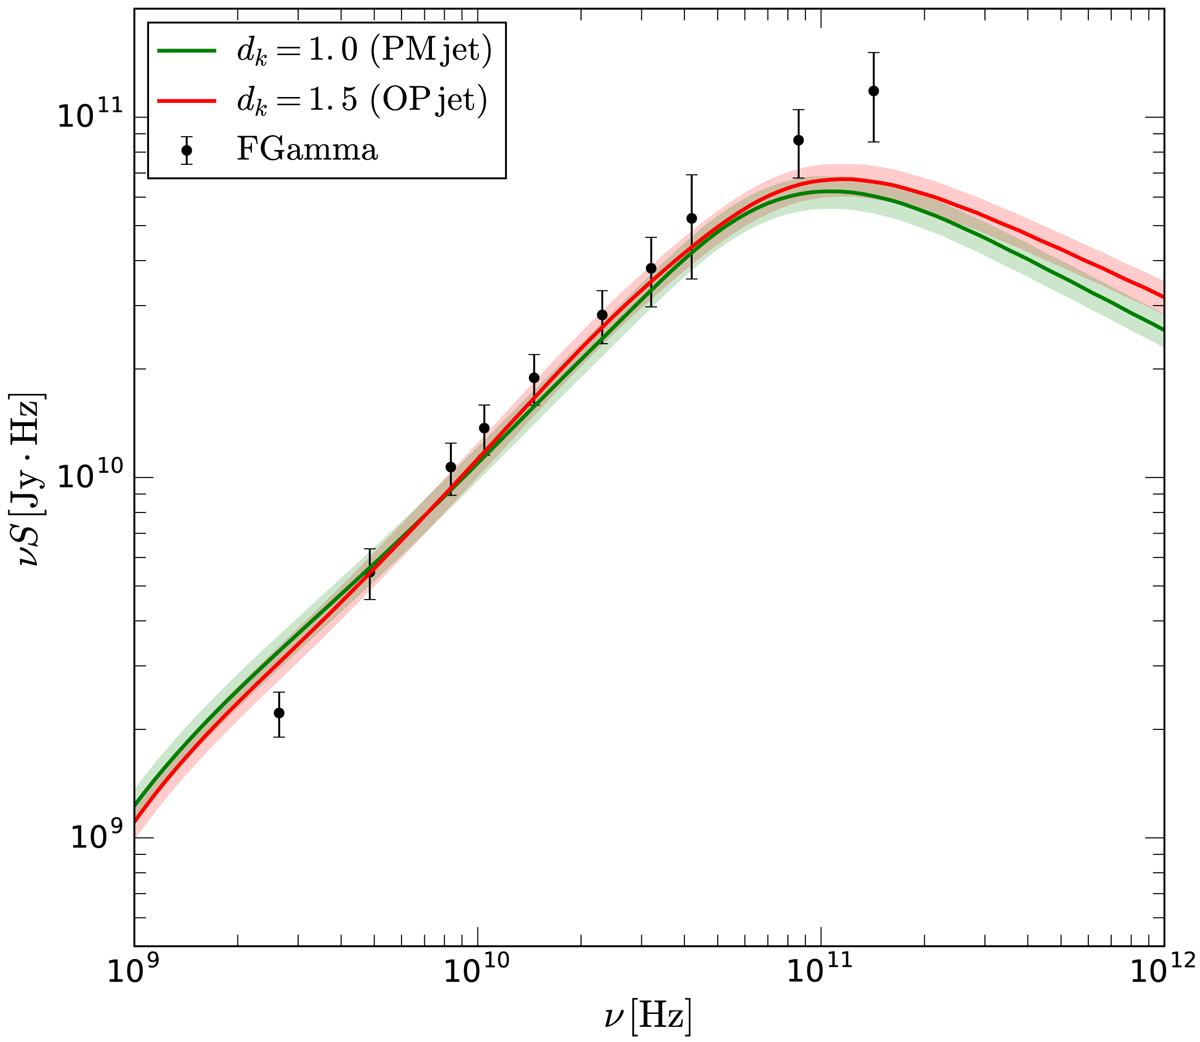
Broadband radio spectrum of NGC 1052 including the averaged observations and the simulated OP and PM jet models. The red and blue shaded regions correspond to 10% flux density variations (see text for details).
Current usage metrics show cumulative count of Article Views (full-text article views including HTML views, PDF and ePub downloads, according to the available data) and Abstracts Views on Vision4Press platform.
Data correspond to usage on the plateform after 2015. The current usage metrics is available 48-96 hours after online publication and is updated daily on week days.
Initial download of the metrics may take a while.