Free Access
Fig. 5.
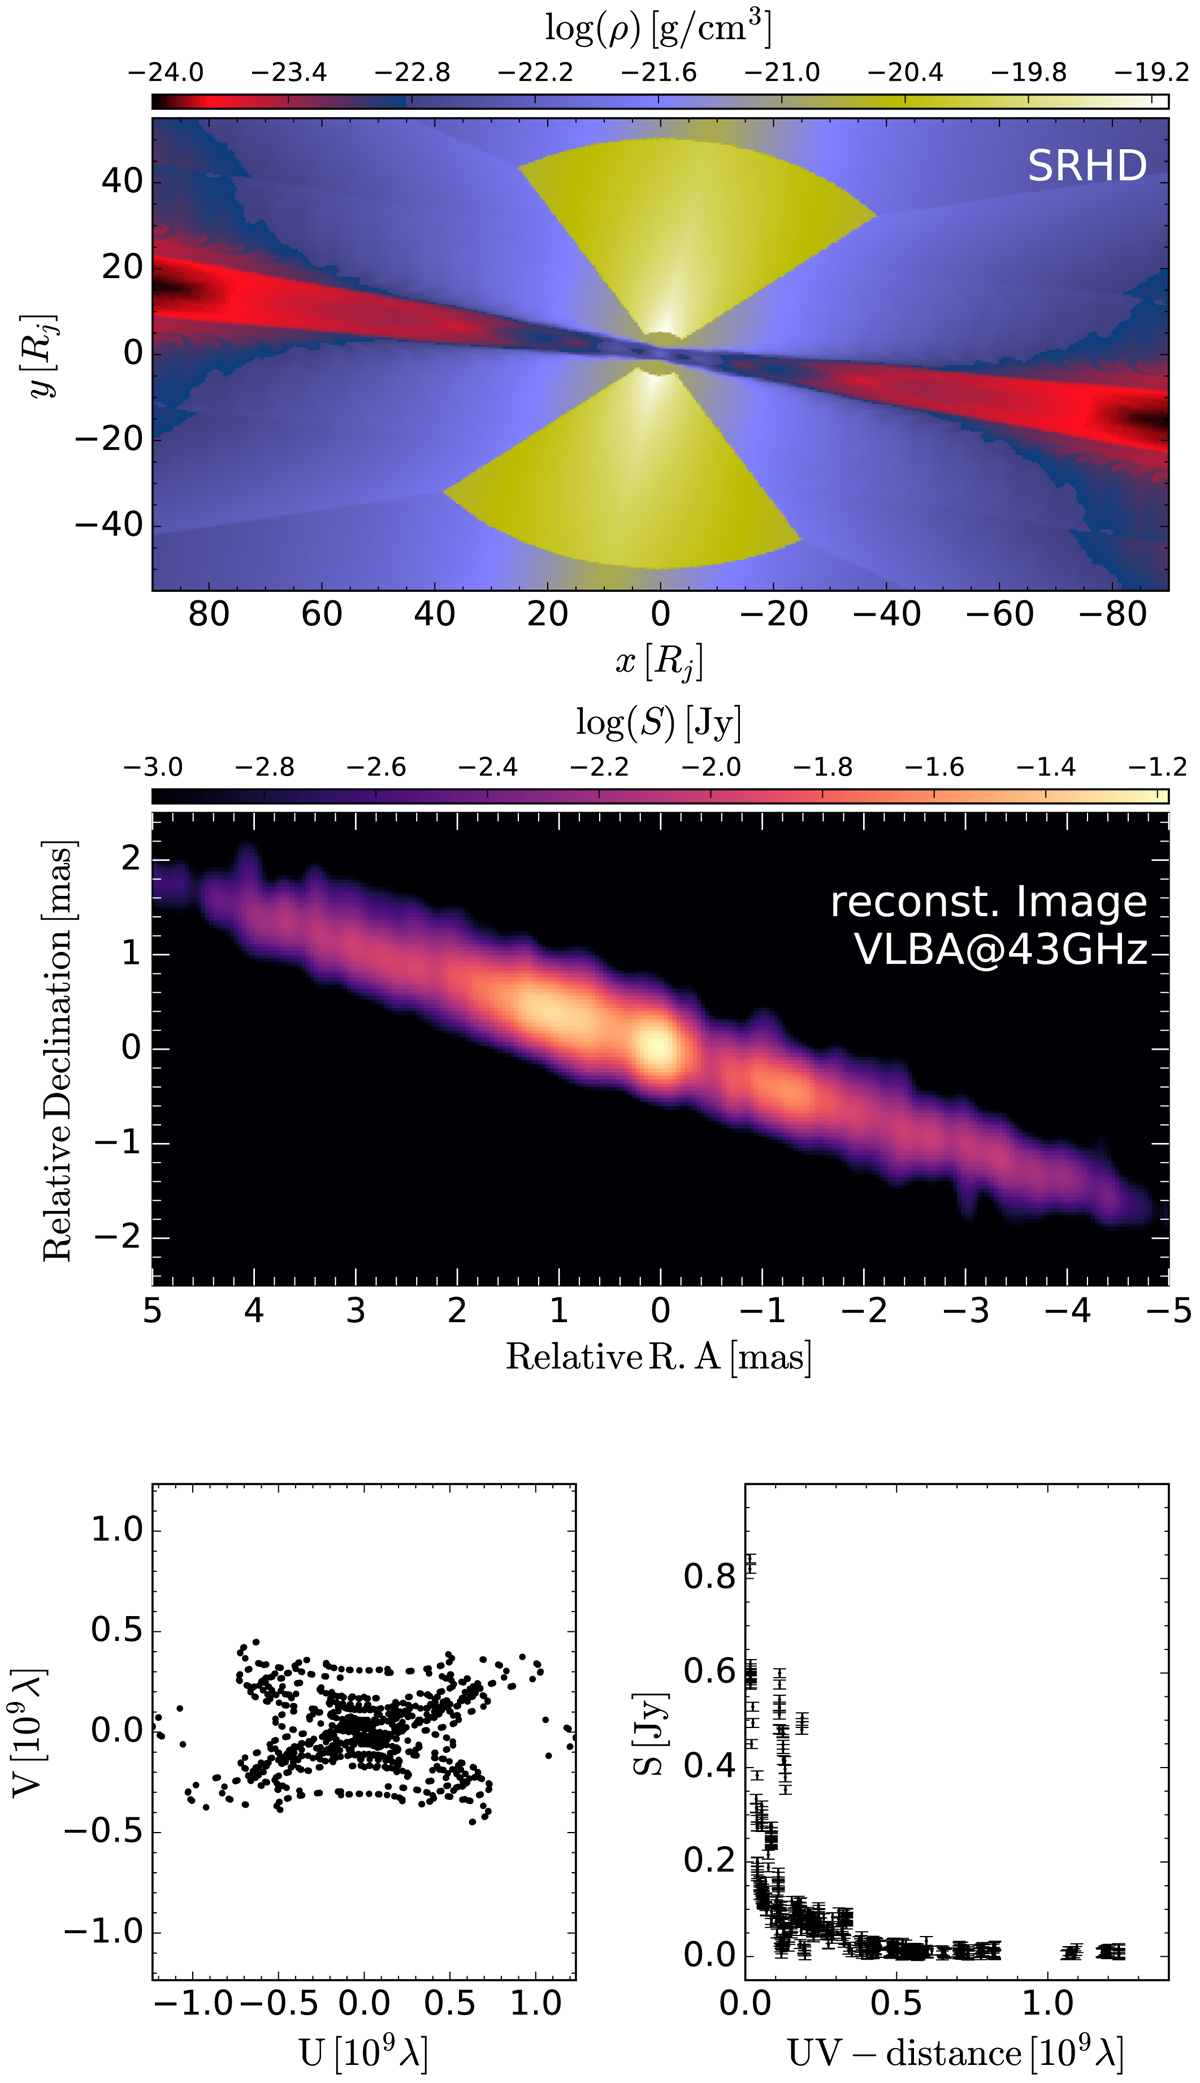
Example from the synthetic imaging routine. Top panel: logarithm of the rest-mass density in g cm−3. Middle panel: reconstructed radio image at 43 GHz as seen by the VLBA and bottom panels: u-v plane (left) and the visibility amplitude (right). See text for details on the jet model used.
Current usage metrics show cumulative count of Article Views (full-text article views including HTML views, PDF and ePub downloads, according to the available data) and Abstracts Views on Vision4Press platform.
Data correspond to usage on the plateform after 2015. The current usage metrics is available 48-96 hours after online publication and is updated daily on week days.
Initial download of the metrics may take a while.