Fig. 3.
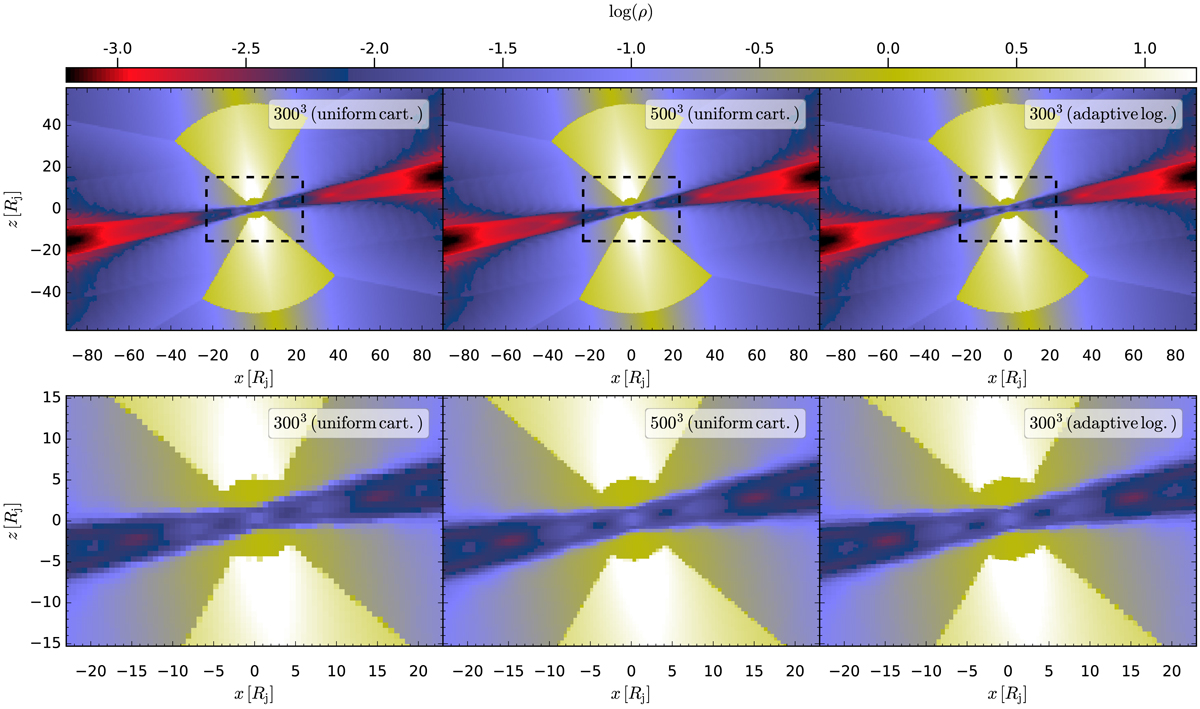
Rest-mass density distribution for different grid resolutions (left: uniform cartesian 3003, centre: uniform cartesian 5003 and right: adaptive logarithmic 3003). Top row: entire simulation box and bottom row: zoom into the central region indicated by the dashed boxes in the top row. The adaptive grid is created using Δ(x, y, z)align, min = 10−3, (x, y, z)scale = 4 and ηx, y, z = 1.15.
Current usage metrics show cumulative count of Article Views (full-text article views including HTML views, PDF and ePub downloads, according to the available data) and Abstracts Views on Vision4Press platform.
Data correspond to usage on the plateform after 2015. The current usage metrics is available 48-96 hours after online publication and is updated daily on week days.
Initial download of the metrics may take a while.