Fig. A.8.
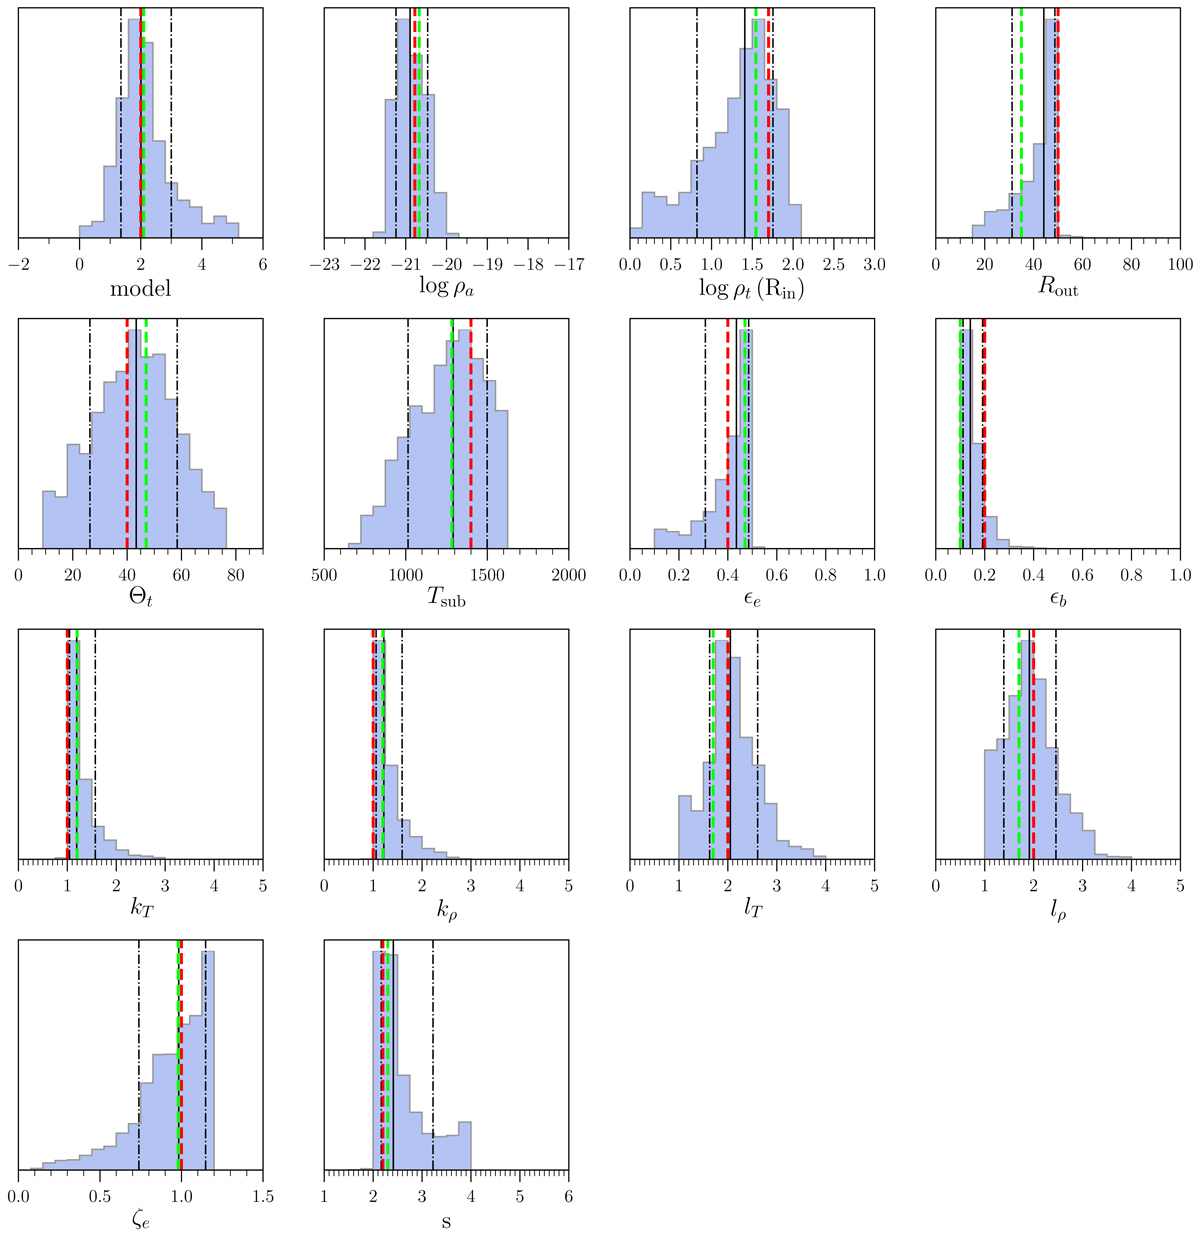
Results for the parameter recovering test for the MCMC simulation and the PSO. The histogram show the distribution of the parameters obtained from the MCMC run, solid black line indicates mean value and the dash-dotted line refer to 1σ standard deviation. The red dashed lines correspond to the parameters of the injected reference model and the green dashed lines to the best position recovered by the PSO.
Current usage metrics show cumulative count of Article Views (full-text article views including HTML views, PDF and ePub downloads, according to the available data) and Abstracts Views on Vision4Press platform.
Data correspond to usage on the plateform after 2015. The current usage metrics is available 48-96 hours after online publication and is updated daily on week days.
Initial download of the metrics may take a while.