Fig. A.5.
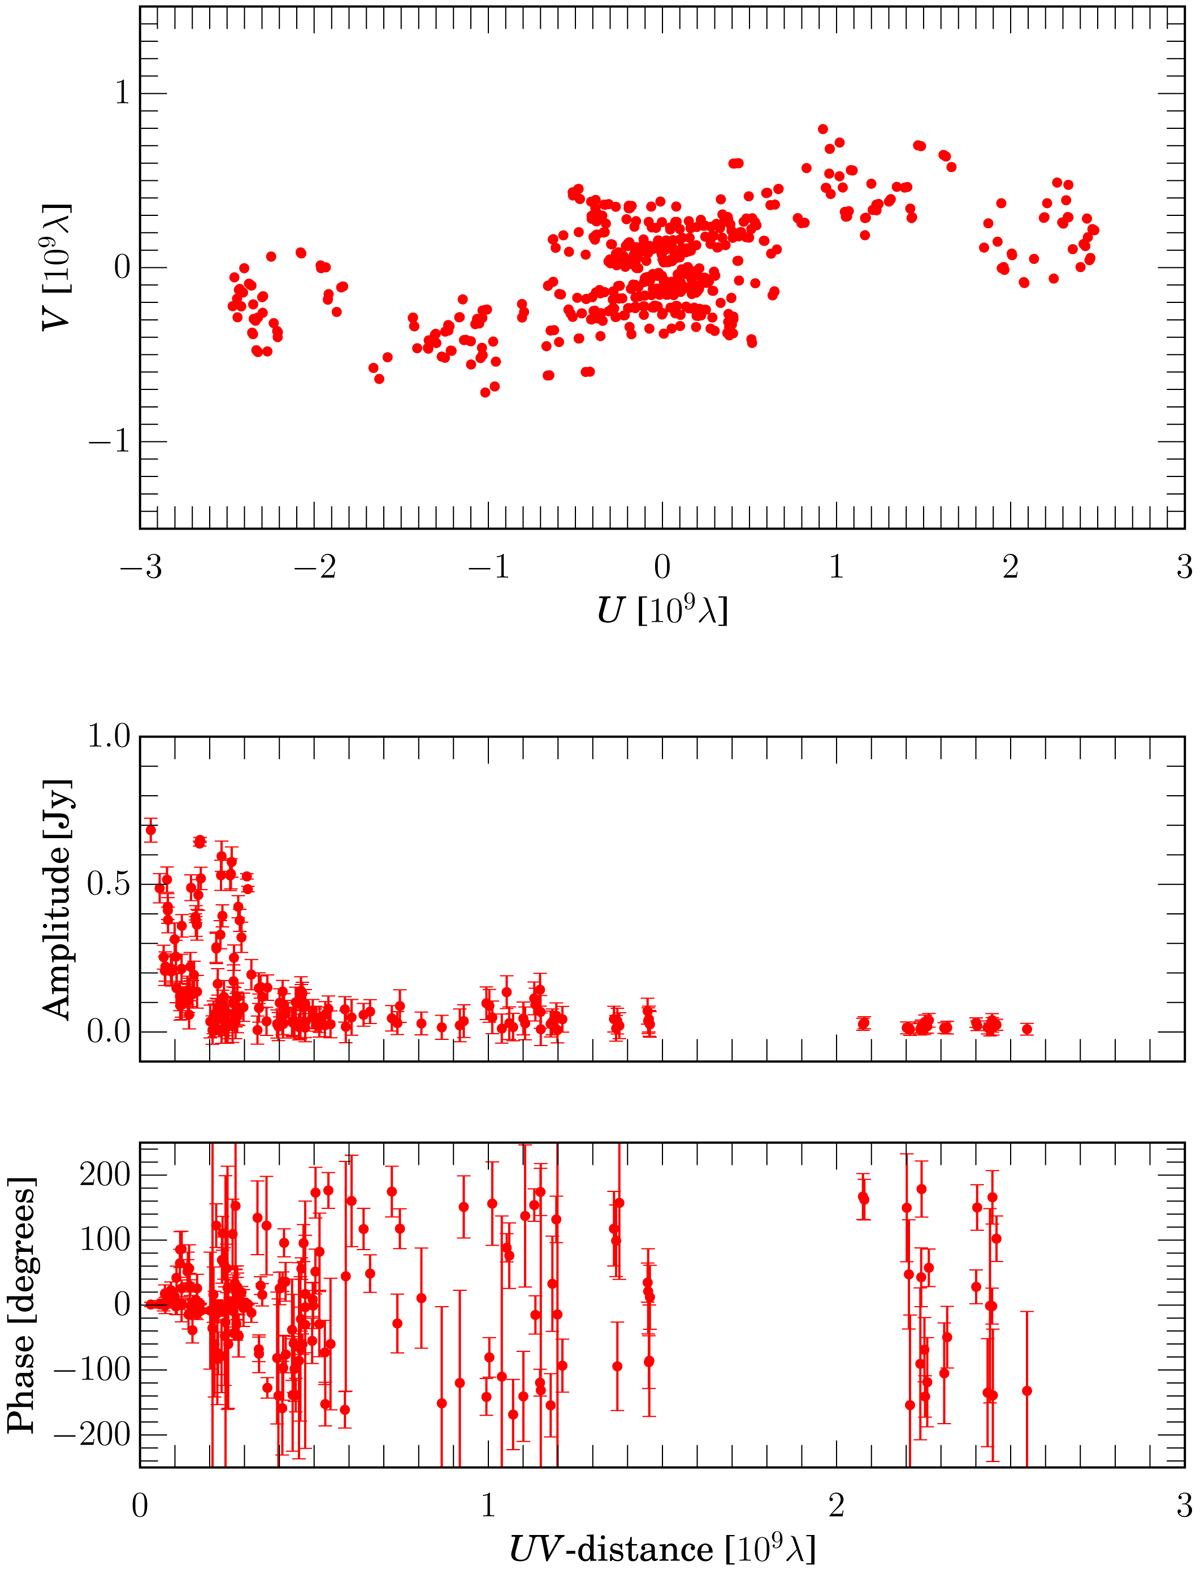
Visibilities for the synthetic RadioAstron observations using the parameters listed in Table A.1 and the observing schedule described in the text. The top panel shows the sampling of the u-v plane, middle panel the visibility amplitude and the bottom panel the phase with uv-distance. For reasons of clarity only every 50th data point is plotted.
Current usage metrics show cumulative count of Article Views (full-text article views including HTML views, PDF and ePub downloads, according to the available data) and Abstracts Views on Vision4Press platform.
Data correspond to usage on the plateform after 2015. The current usage metrics is available 48-96 hours after online publication and is updated daily on week days.
Initial download of the metrics may take a while.